

Trading Research: How to Use RVOL to Gauge Volatility
Trading Research: How to Use RVOL to Gauge Volatility
In the Trading Lab

"Research is the foundation of informed trading. It empowers us to uncover hidden opportunities, understand market dynamics, and make informed decisions. In the trading world, knowledge is the key that unlocks the door to success." — Unknown.
Dear Readers,
A few weeks ago, Leo published a great article on RVOL1.
Until that day, I wasn’t aware of this tool. From the first few lines, I was hooked. Do you know that feeling when something feels simple, intuitive, and easily applicable? That’s exactly what I felt.
Today’s article aims to summarize and share some of my research. Why? Because I believe in karma. After all, if Leo didn’t share it in the first place, I wouldn’t have this new tool in my arsenal.

Before we start and you get too excited, let me remind you that there is no such thing as a magical tool. Just tools.
I don’t have much experience with RVOL, but I have Alfred, who has studied the relationship between RVOL and Price Action for the last decade.
We’ll start by reviewing definitions and data analysis over volume and volatility in $NQ over the last few years.
We’ll then try to answer the following question “From which point in time during the day can we form an assumption on the remaining volatility of the session?”. The more we wait, the more accurate our estimated RVOL will be, but the less time we will have to try to take advantage of the potential volatility.
As you see, this is not an easy task. Before we start, I’d like to thank the OFL crew who keep doing an amazing job for our community. They are knowledgeable, don’t get involved in drama, and almost never shitpost (how do they do that lol?!).
As a reminder, here’s the editing plan for the next few weeks:
June 28: Simplifying your Trading
July 2: The Best Paid Services to Kickoff your Career (Not Affiliated)
July 5: Interview with [redacted]
Spread the word into your discords & Twitter. This article took me considerable time, so I’d appreciate a share, even if you don’t have a lot of followers (it’s the gesture that counts).
Definition
In trading, "volume" refers to the total number of shares or contracts traded for a particular security (such as stocks, bonds, or options) during a given period. It represents the level of activity and liquidity in the market for that security. High trading volume often suggests greater market liquidity, indicating that there is a higher number of buyers and sellers actively participating in the market. Conversely, low trading volume can indicate less interest and participation, potentially leading to less liquidity and increased volatility.
But is this true? Before going deep into a topic, I do some basic checks to ensure I don’t waste my time. At the end of each day, is there a positive correlation between the volume and the volatility2?
Historical correlation
Alfred gathered the total volume by day and the daily range since 2008. For visualization purposes, I’m only showing the relationship between these variables. The data are from the CBOE on $NQ.

We observe a positive correlation between these two variables of 0.54 (we usually consider noise anything between -0.3 to +0.3). The R-squared is a bit low at 0.29.
There is some noise on this graph, but it’s pretty clear that on average, the higher the volume, the higher the range.
If you’re not familiar with these types of graphs, you can read them as in the below chart.
 / Twitter")
This is some hindsight analysis, so not very useful during the day. We wanted to ensure some correlation exists before we start the actual work, but it doesn’t mean it has to work.
Ready?
Deep dive on the realized volume through the day
This section looks at how the volume develops throughout the day, from the overnight action to the after-hours. There are different ways to do it, but for me, a trading day starts at 6:00 PM and ends at 4:59 PM on the next day. The overnight (‘OVN’) action is everything from 6:00 PM to 9:29 AM, and then every 30 minutes is labeled by a letter:
A for 9:30 AM to 9:59 AM (both included);
B for 10:00 AM to 10:29 AM (both included);
…
M for 3:30 PM to 3:59 PM (both included);
AH for 4:00 PM to 4:59 PM (both included).
I hope it makes sense. That’s how I built my Period column inside my database for Alfred.
I looked at the data from January 2019 to this date and have summed the volume inside each Period of each day and averaged it over the 4.5 years of data we have. Doing it this way gives us an idea of how the volume evolves throughout the day (on average).
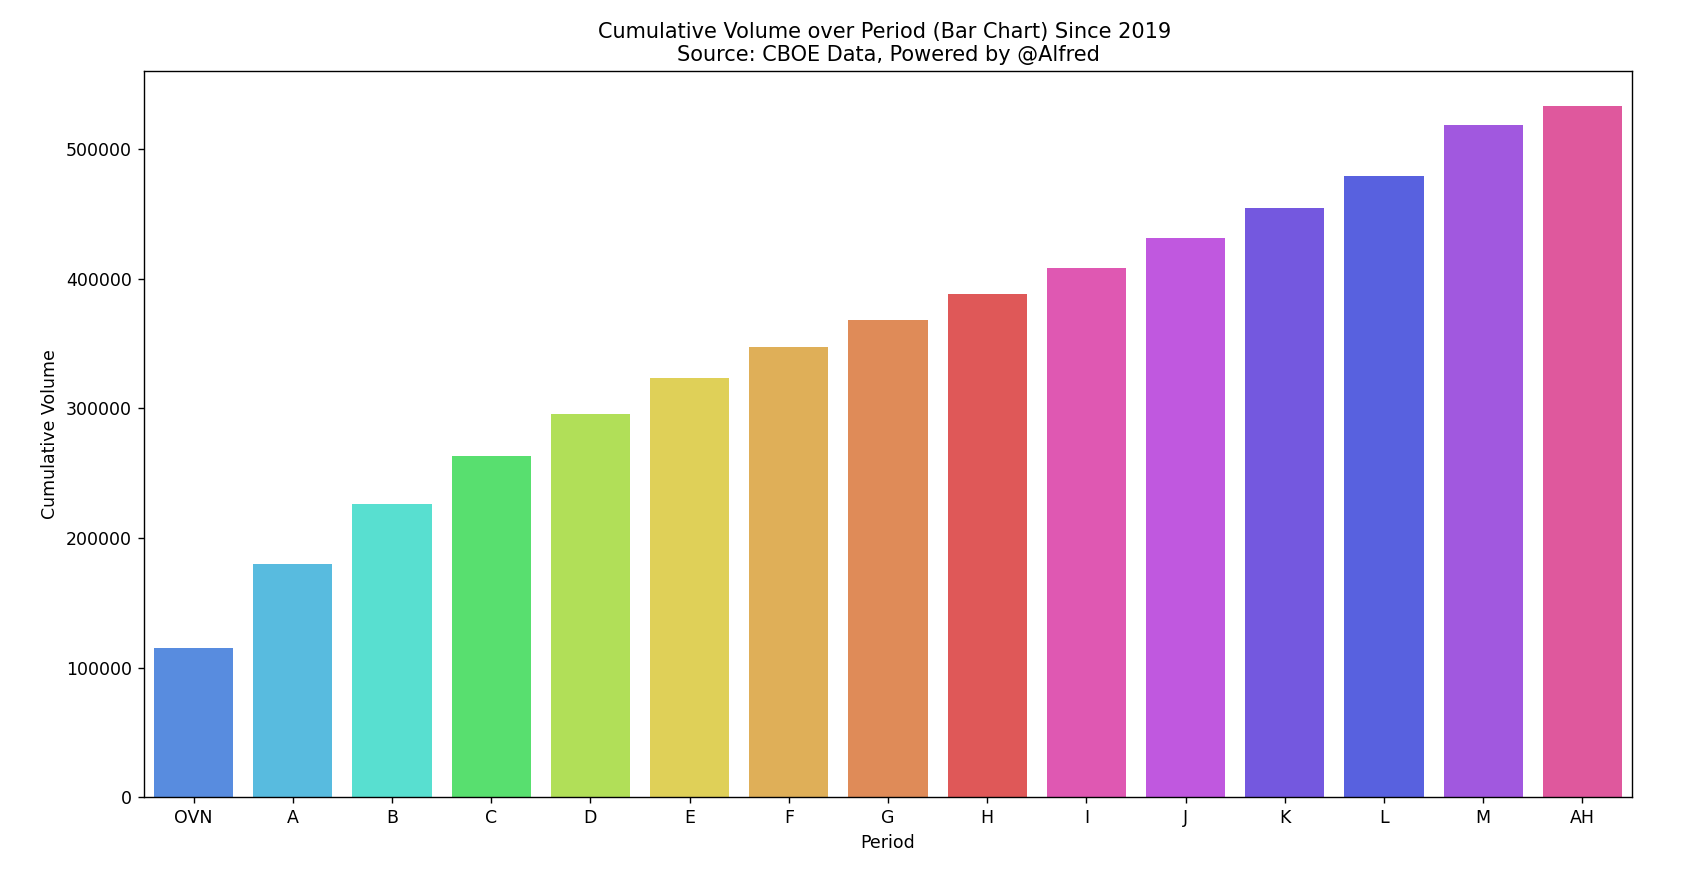
We can see that most of the volume per period is done in OVN (expected, as it’s the longest period from a time perspective). The biggest jumps are between OVN and A, then A and B, and finally L to M. After that, there is not much material variation from a volume perspective between the two periods. Why does it matter? Because we want to know from which point a good part of the day's business has been done, we can try to form assumptions about RVOL later in this article.
If you don’t get it, don’t worry; here’s another view.
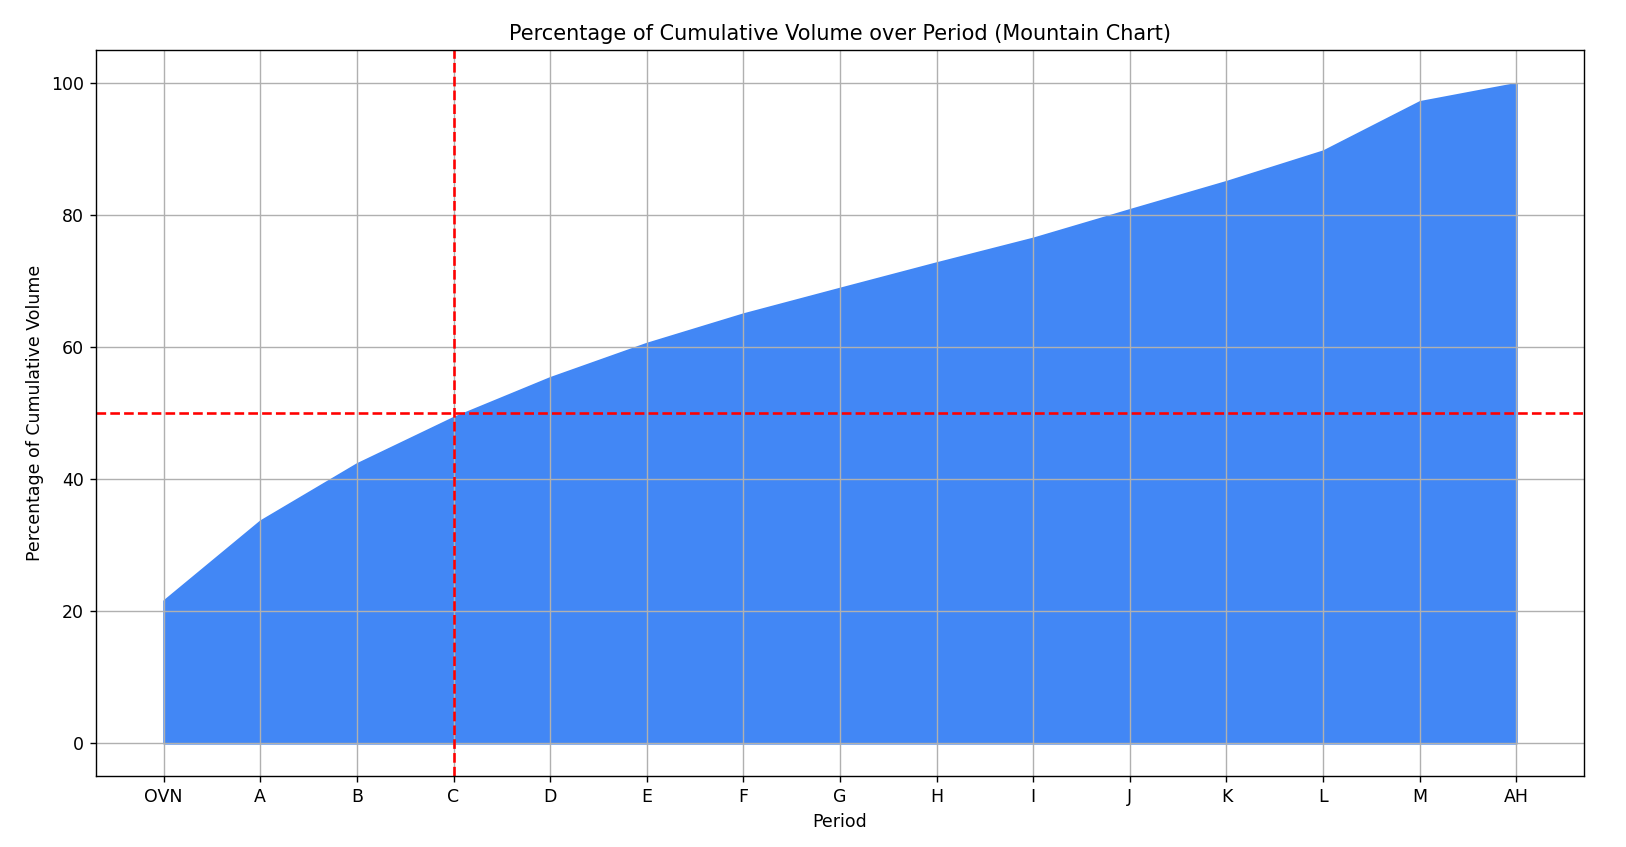
This different representation shows the average cumulative percentage of the volume done throughout the periods. The red dashed lines show the period at which we have done, on average, 50% of the daily volume.
Some observations:
C. 20% of the daily volume is done overnight;
C. 50% of the daily volume is done by 11:00 AM;
C. 60% of the daily volume is done by 12:00 PM (lunchtime);
C. 10% of the daily volume is done from 3:30 PM to 4:59 PM.
Why does it matter?
Let’s say we have an RVOL of 2 by 9:30 AM. Can we form a strong assumption for the rest of the day? Probably not because only 20% of the daily volume has been done; this assumption is precarious. You can make any assumptions, but just be aware of the context.
This latest graph can also help you be more realistic in your trading. When only 20% of the volume is left to be done by 2:30 PM, do you really want to take that big risk this late in the day? Can you consistently get that big move you’re looking for?
To answer the question, “From which time during the day can we form an assumption on the remaining volatility of the session?”, I would say that after the Initial Balance (IB, first hour of RTH), we can start relying on RVOL, since c. 45% of the daily is expected to be done.
Implementation in Ninja Trader
Since I enjoy this view of volatility through volume (something I use all the time), I’ve been working on an RVOL indicator for NinjaTrader. It was very painful to do, as my skills in C# are not the same as my Python (sadly). It took me probably 20 hours to code it, but I think it’s working well now. Worth it.
As you can see on my below chart, the RVOL is printed at the top left of my candles and is updated at the end of each candle.

I show below the conclusion from the Orderflow Labs team.

What’s next?
Something interesting is to look at the RVOL from a specific time in the day and see if the volatility (range) is indeed bigger/smaller than the average of the previous days at the end of the day based on the RVOL value. From this point, we can categorize our days in 2/3 buckets as they did.
I hope this article gives you some idea on how to do some research when something grabs your attention.
Next articles:
June 28: Simplifying your Trading
July 2: The Best Paid Services to Kickoff your Career (Not Affiliated)
July 5: Interview with [redacted]
Maybe I’ll add in between a market review on $NQ if I’m not too lazy.
Thanks for reading & I wish you a great Sunday.
Stay safe.
— Retail
PS: If you still want to read, head over to
or substacks!Relative Volume (RVOL) refers to the comparison of current trading volume to its average volume over a specified period. It provides a measure of the current trading activity relative to the typical or average trading activity for a particular security.
I use the daily range as a measure of the volatility.
This is seriously interesting. I've only ever looked at daily range before now. Very helpful 👍
Fantastic post as always Retail!