

How Programming Transformed My Trading
How Programming Transformed My Trading
And why you should use it too


Welcome to this new edition of The Statistical Edge.
Subscribe below and join 1200 traders.
Useful links:
📝Previous articles: read here
Twitter: @itsonlymoney12
📩 retailcapital9@gmail.com
Looking to trade $NQ, ES 0.00%↑ , CL 0.00%↑?
You can get funded for less than $100 with Apex. If you want to try the Apex Funded programs, you can use my affiliate link here with my 50% coupon code: RETAILCAPITAL, which will always apply the best available promotion.
Happy Sunday, Traders.
Today, I will share how I use programming in my daily trading activities. I aim to motivate at least ONE of you to build your database. Lately, a thousand people have read my Sunday letters, so I think my odds of success are pretty high.
This letter will cover the following:
Setting time aside to start learning to code
Testing new strategy ideas quicker
Getting a better knowledge of different markets
Bonus: Building your ideal trading partner @Alfred
Sit back, relax, grab your coffee, beer, or whatever you’re drinking, and let’s dive in.
Before we start, I’d like to know my audience better. Please answer this poll to help me adapt my content. Thank you.
Setting time aside to start learning to code
I always get comments on my Twitter like ‘but I don’t know how to code’, ‘it looks cool, but where do I start?’, ‘where do you get your data?’.
Let me tell you something; I have been in the same situation. I wasn’t born as a coder. I still face programming difficulties every single day. Programming is a challenging discipline. But the rewards largely outweigh the day-to-day struggles.
The great thing about programming is that you see progress every time you code.
Every problem you’re facing already has a solution online. Stackoverflow is the greatest Q&A programming website. I always have one tab open with Stackoverflow to browse for answers to my problem. I spend more time looking for pieces of code online than coding.
My advice to you
Start today. Start by doing something simple that would help you in your trading.
I have some colleagues who started learning to code with the TradingView scripts module. If you’re really scared of Python, I’d advise you to start with the TradingView programming module, which is straightforward.
Testing new strategy ideas quicker
Today we are testing the following assumptions:
Is it a good strategy to go long when a candlestick makes a wick below a 4H low?
Visually, this is what it looks like:

Prices quickly dip below the 4H low before closing above.
Is it a good strategy to buy at the close of this candlestick, hoping for prices to rally?
We will follow this simple 5-step plan:
Presentation of the data
Reorganizing the data
Coding the rules that we want to test our strategy
Measuring the success/failures of the strategy
Draw conclusion
If, at any point, it seems too complicated, please reach out through the comment section or on Twitter.
Presentation of the data
We will use the 1-minute candlestick data on the $NQ, downloaded through NinjaTrader. For our example, the data goes back to March 2022.

Reorganizing the data
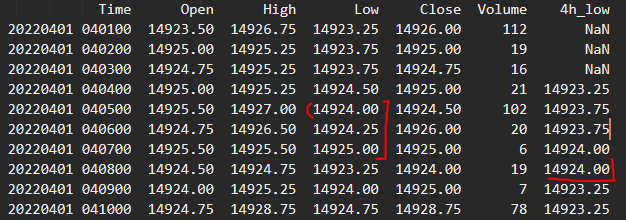
We can transform the bad-looking txt file with a few lines of code to the below dataset. We also added a column called “4h_low” to show the current 4H low (excluding the current candlestick). For the sake of the below screenshot, I’ve put a 3-min low in the “4h_low” column so you can easily see how it works (otherwise, the dataset is too big to show here).
Here’s the code used to get the above dataset.
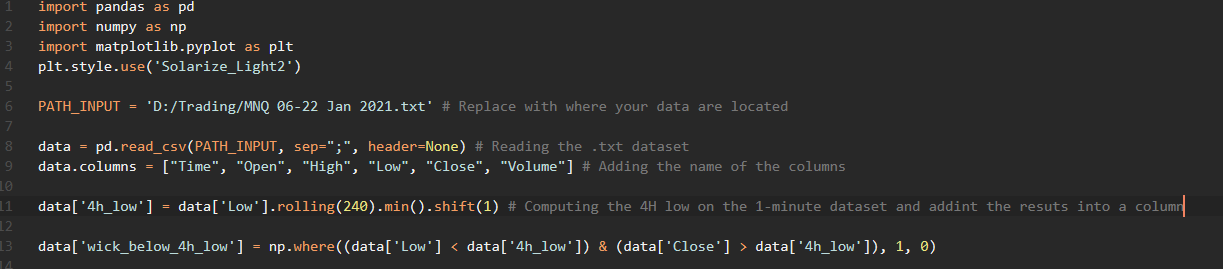
Coding the rules that we want to test our strategy
We first need to tell the algorithm to alert us when a one-minute low is below the 4H lowest point AND closes above it. To do so, we need to use conditional formulas and add a new column that we call ‘wick_below_4h_low’, which will:
1 if the conditions are met;
0 otherwise.

Since March 2022, we have had 75,928 1-minute candlesticks in our dataset. 1,135 of them meet our criteria. 1.5% of the time, the criteria are triggered. Do you start to see how cool programming is? We already know exactly how many times our idea occurred in the past!
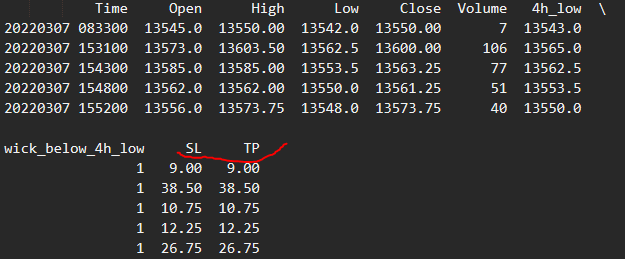
Now, we’re adding two more columns: SL and TP. We decide to start with a take profit equal to the stop loss. The Stop Loss has been calculated as the Close - Low of the signal candlestick plus 1 point to avoid getting stopped on a retest. This is what it looks like:
Measuring the success/failures of the strategy
Now that we have our TP and SL in place, let’s look at the results it would have produced. If the prices first reach the SL, it’s a loss in the ‘Output’ column. If prices reach the TP first, it’s a win in the ‘Output’ column. If both are touched during the same candlestick, the row is removed (for simplicity reasons - it doesn’t happen too often. For a proper backtest, this should be studied more in-depth).
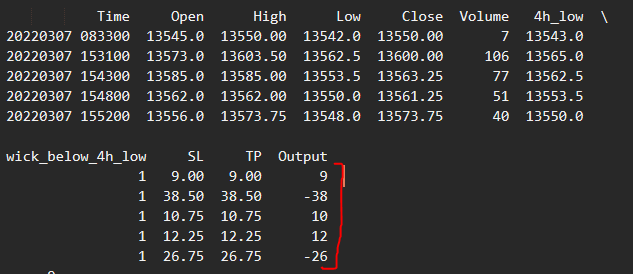
Above is an extract of our new dataset with the result of the first five trades in the ‘Output’ column.
Let’s plot the results to see what it looks like.
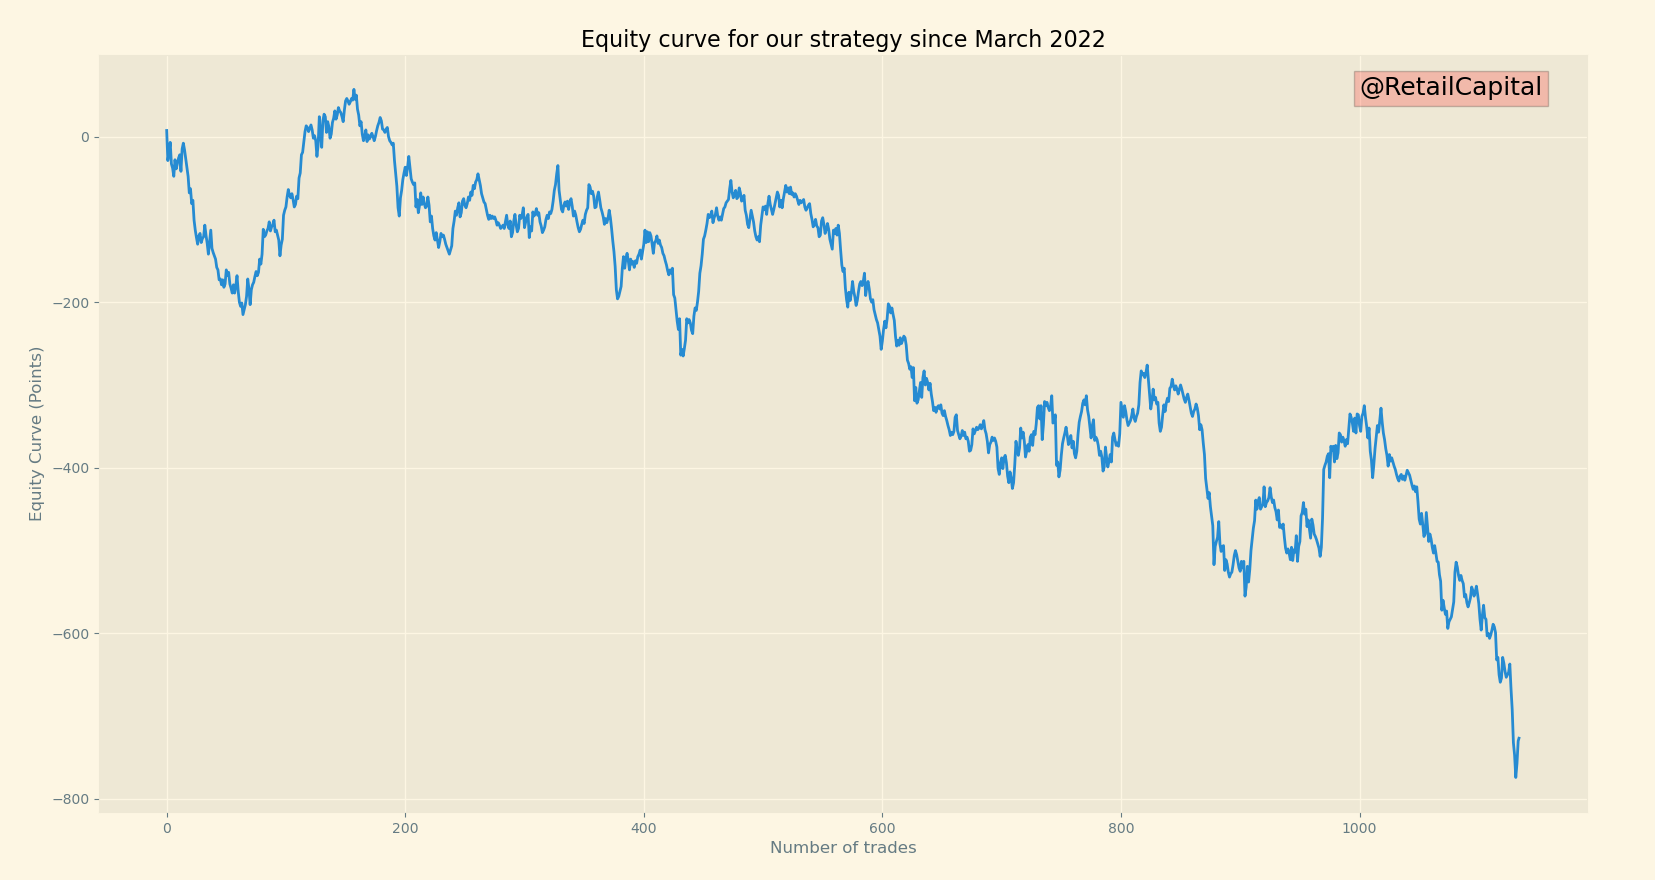
Yikes… It doesn’t look great. To give some perspective, 1 point on the Nasdaq is worth $20, so this would result in a loss of c. $14,500 before commissions (I don’t consider commissions for simplification reasons, but it’s not difficult to add them).
Let’s try to understand what’s going on here.
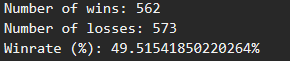
We have 562 winners and 573 losers. Our system wins 49.5% of the time, yet, we lose a lot of money. Weird?
Not really! We also need to look at the average winners against the average losers. You can win 50% of the time, but if your losses are bigger than your winnings, you’re ngmi.
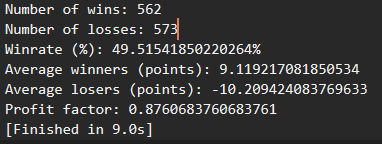
Our average winners are 9.1 points against -10.2 points for our average losers. Maybe it seems like an insignificant difference to you. But over more than 1,000 trades, it leads to a massive loss. The profit factor (total winners divided by total losers) is sitting at 0.88, which is terrible (ideally, I target a profit factor above 2).
And it took only 9.0 seconds for the Python code to get our statistics. Maybe 5 minutes to write the whole code.
Now that we covered how fast it is to backtest some ideas, let’s see how data can help you understand different markets much quicker than if you would learn it the old way.
Getting a better knowledge of different markets
The beauty of having a database is that you can ask all the questions you want and have an answer in seconds. Would you do it manually, it would take hours!
I want to show you two sides @Alfred today:
Future Module
Stock Module
I will not cover the predictive module of @Alfred, as I’m not sure yet if I want to discuss this publicly.
Future Module
I have shared some of the charts that @Alfred produces on my Twitter account.


I only trade $NQ, so that’s what I share, but I still have ES 0.00%↑ and the other indexes in my database. Maybe one day I'll become wiser and switch from this degen index to trade a more normal one.
Anyway, one of my mentors taught me to look at the market per intraday session: Globex, London, RTH, and After Hours. I know that Globex is sometimes considered just for Sunday, but I don’t know if there’s an official definition somewhere, and I don’t care. To me, it’s from 6 pm to 3 am NY time.
If we look at last week, here’s what @Alfred produced.

I go further and look at statistics on years of data by the type of market conditions that I have defined. I usually trade with more lots when there are asymmetrical risk-reward situations.
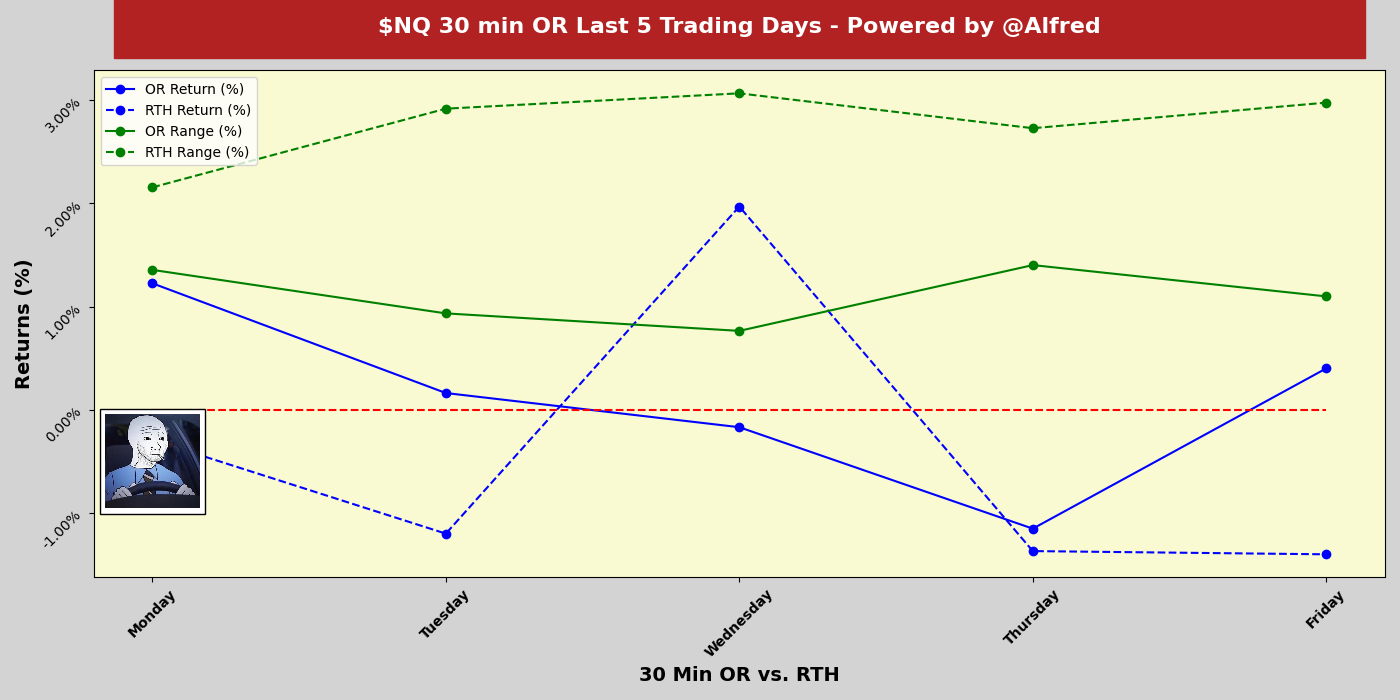
In the above chart, I look for continuity over multiple days to stack odds in my favor. Again, I don’t only look at the last five days, this is what I extract for you here, but I’m naturally not sharing my statistics with you.
Finally, a new report I’m working on sharing publicly regularly is a simple Buy The Dip (‘BTD’) or Buy The Rips (‘BTR’) algorithm.
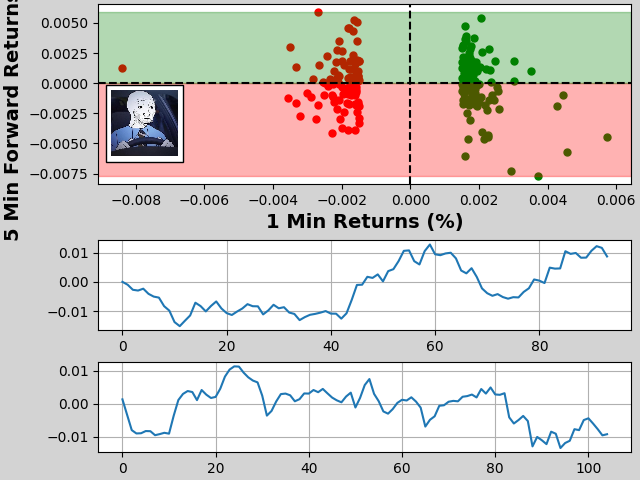
It’s not finished, so I’m still missing some formatting on the numbers, but here’s how to read it:
The top graph is a scatter plot that shows in red (respectively green) the 5 minutes forward return after a 1-minute candle closed at least 0.25% in the red (respectively in the green).
The graph in the middle shows the cumulative returns if you buy every 1-minute dip and close the trade 5 minutes later.
The graph at the bottom shows the cumulative returns if you buy every 1-minute rip and close the trade 5 minutes later.
Overall, this simple strategy produced c. 200 trades last week and mitigated returns. But it does give a good view of how much the market is trap-ish. One of my favorite graphs to work on!
I built so much more in the background, and it’s an incredibly fun journey.
Stock Module
A few weeks ago, I was interested in NVDA 0.00%↑ due to the recent volatility. Bear in mind that I know nothing about stocks. But that's ok because I can still get valuable statistics on any stocks traded in the US market. And that, my friend, is the beauty of programming.
Caveat: I’m not sharing all the insights from my database. I decided to only share with you data from January 1, 2018. For the S&P stocks, it already represents roughly 5,626,000 data points (500 stocks * 250 trading days * 4.5 years * 10 fields). After reading this section, I hope that some of you will find the motivation to build one. Actually I don’t like approximation, there are exactly 5,732,130 entries in this extracted database.
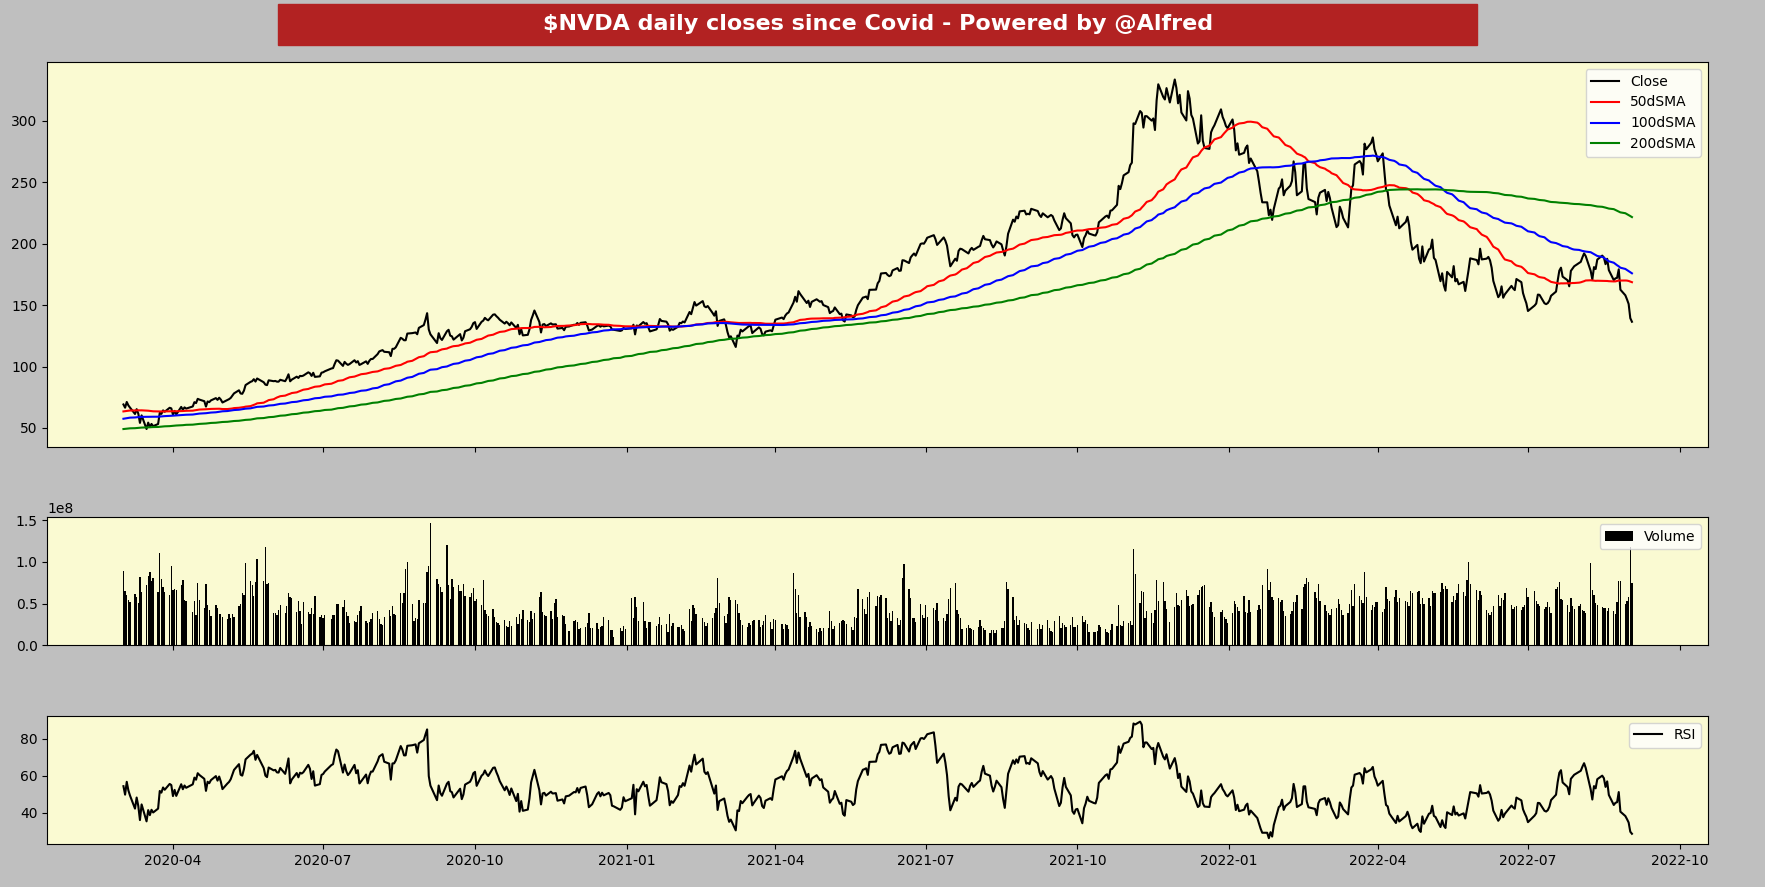
Daily closes since Covid
Let’s start with the basics and extract some action on NVDA 0.00%↑ from my database. I decided to look at the daily close since Covid, with some classic SMAs, Volume, and RSI indicators. Any website can give you the daily close with the indicator you want on, so there are no real added benefits to this section besides the fact that I can customize my charts the way I want.
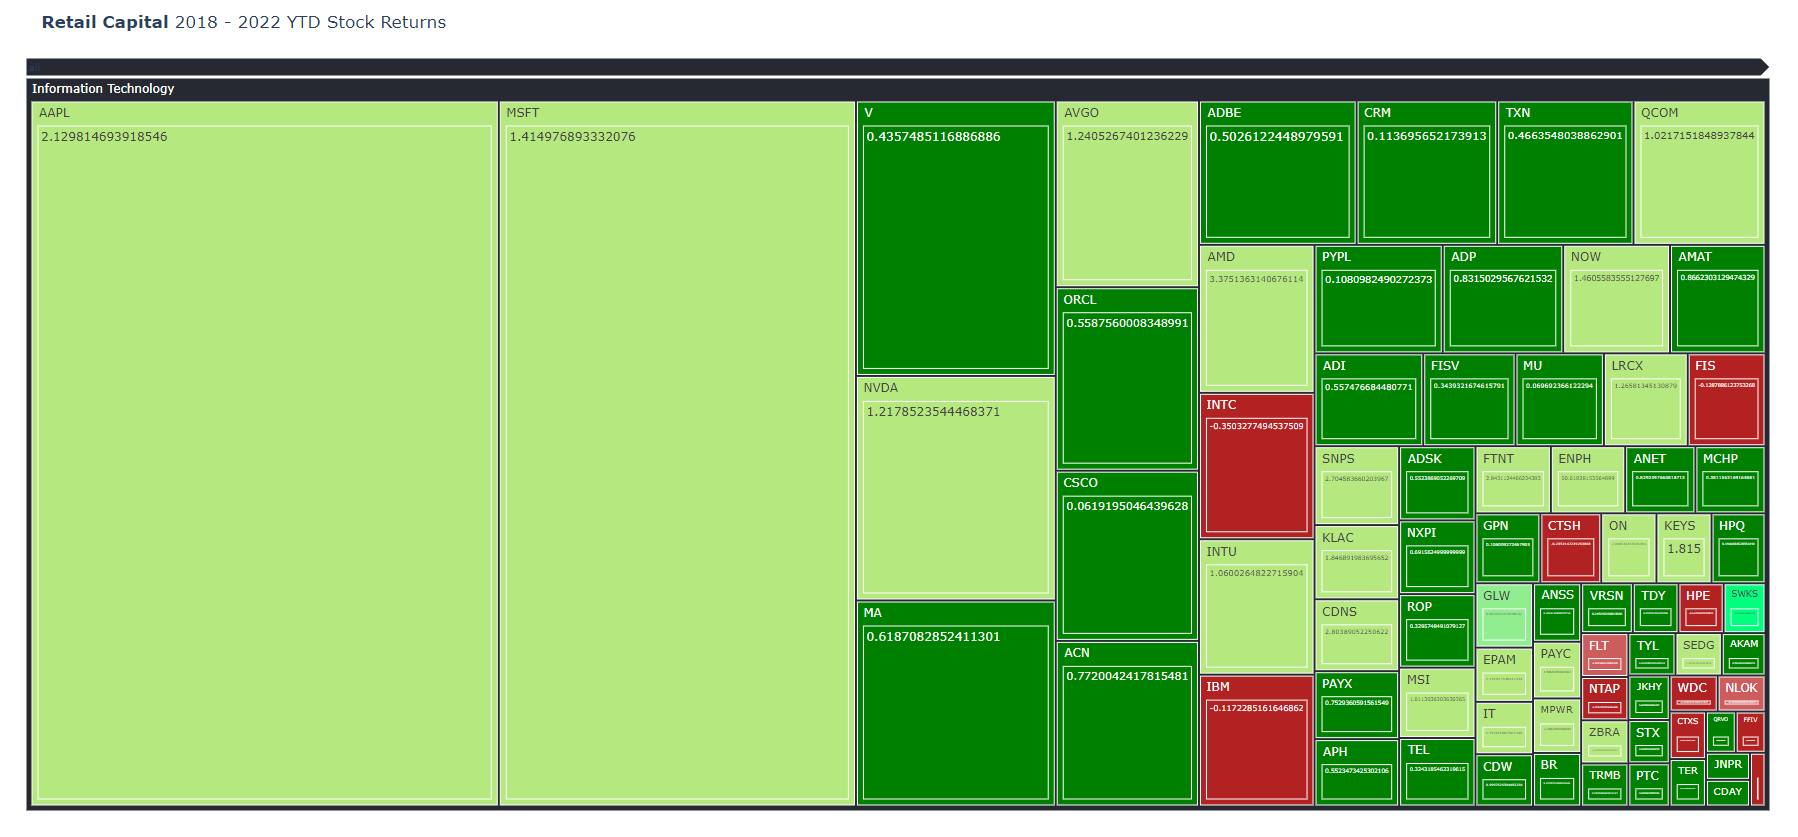
Sector view - Information Technology
Something that you’ll find less easily on your trading platforms is a view of all the sectors within the same sector. For NVDA 0.00%↑ , the sector is Information Technology.
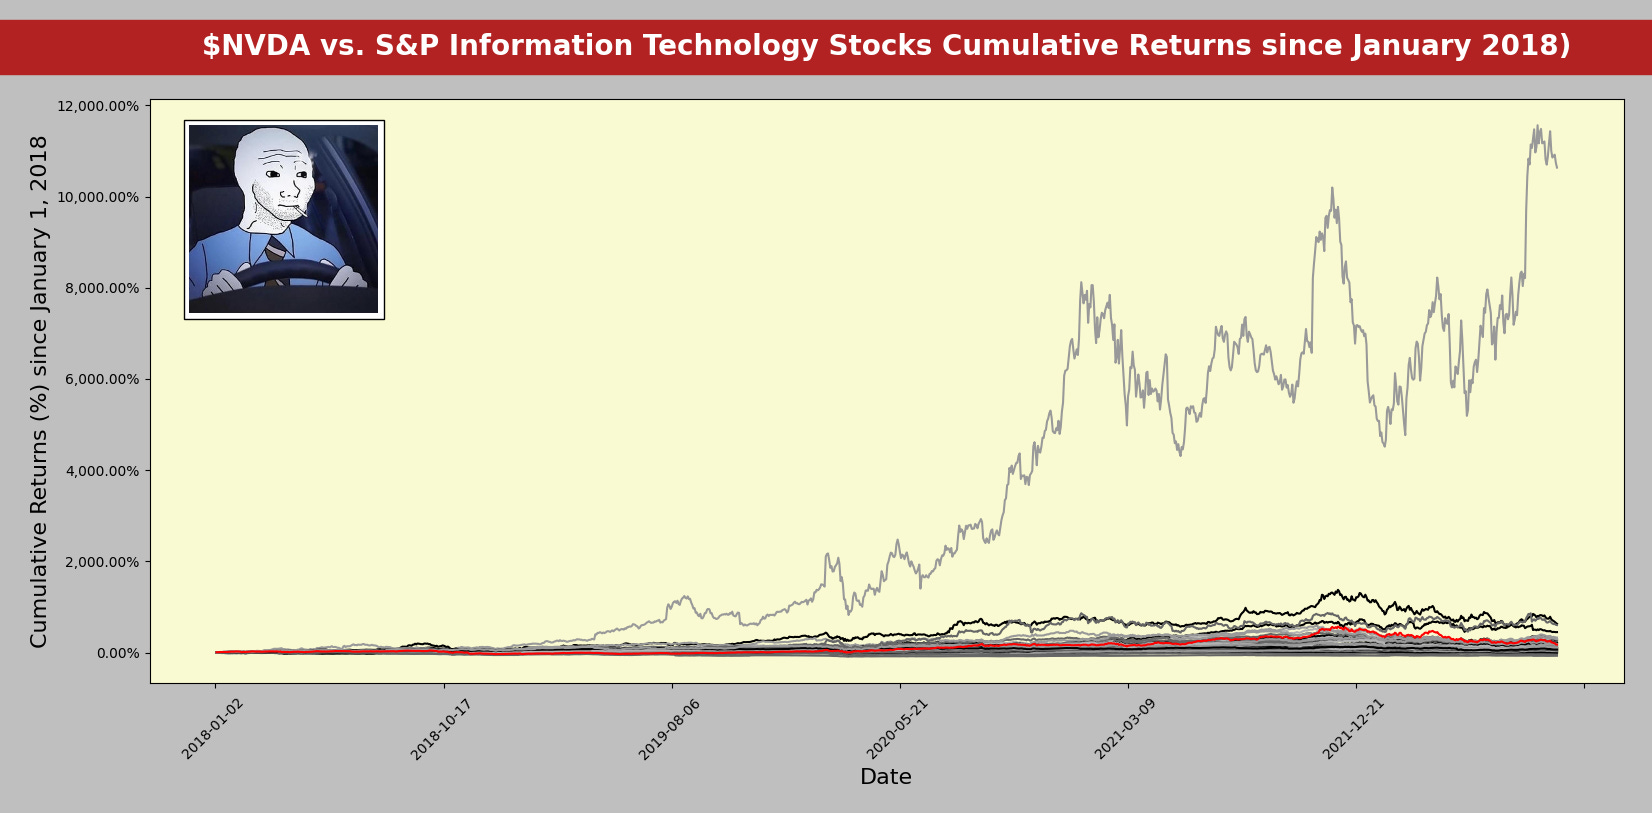
It seems that there is one outlier that had insane returns. This prevents us from seeing the red line that represents $NVDA.
Luckily, with just a few lines of code, I can identify that this naughty boy is ENPH 0.00%↑. For this case study, I will remove it from the graph.
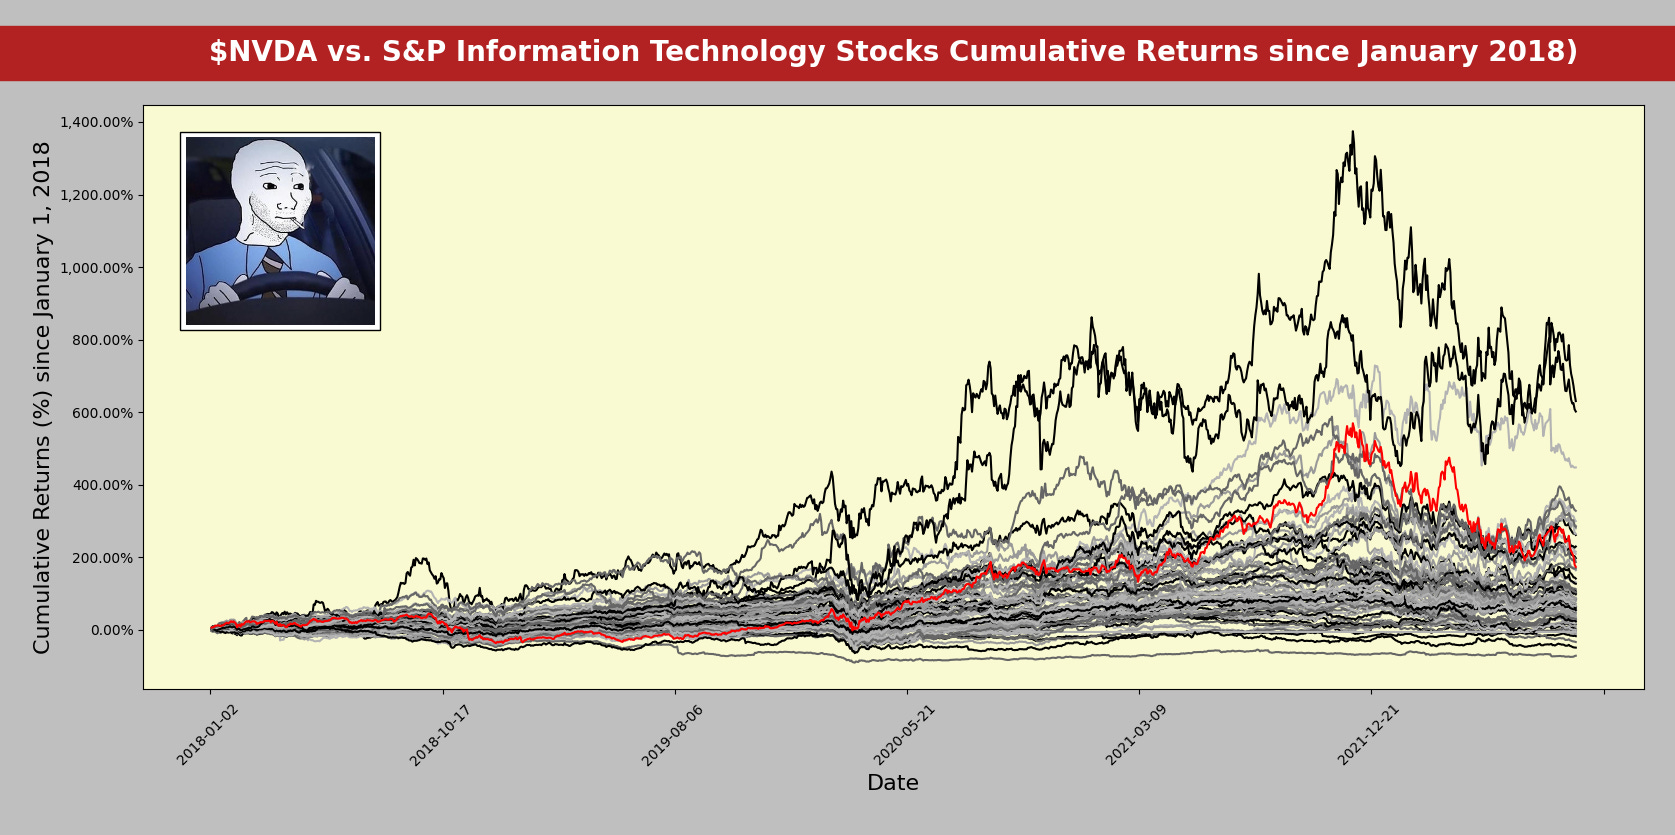
Alright, it looks better now. Hard to miss that NVDA 0.00%↑ has been one of the top performers since January 1, 2018 (red line).

Not too bad considering that there are 76 stocks in this sector.
I like this view, but I know some might not be used to it, so I also extracted a more appreciated visualization format for you guys: the treemap.
Treemap Sector View
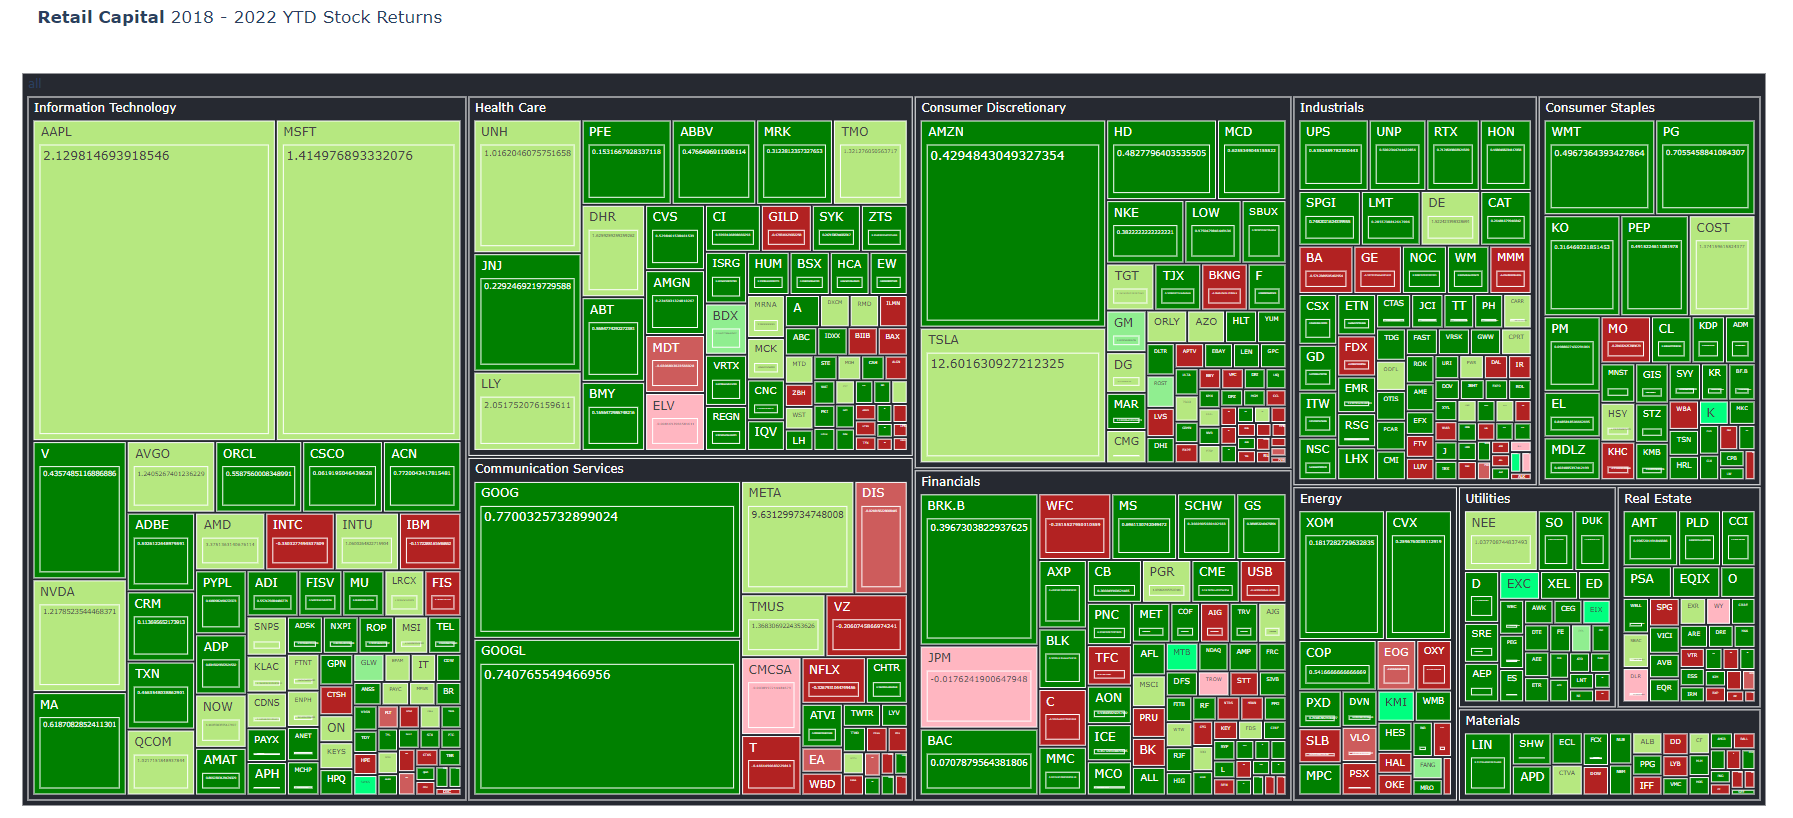
A sea of GREEN. Always good to remember during darker times that stocks have been performing exceptionally well over the last few years. However, there might be a small mistake in the calculated returns in this treemap. I’ll investigate later this week, but I don’t have more time today.
Correlation Radar View
Let’s look at the correlation between NVDA 0.00%↑ and the other stocks in the sector.
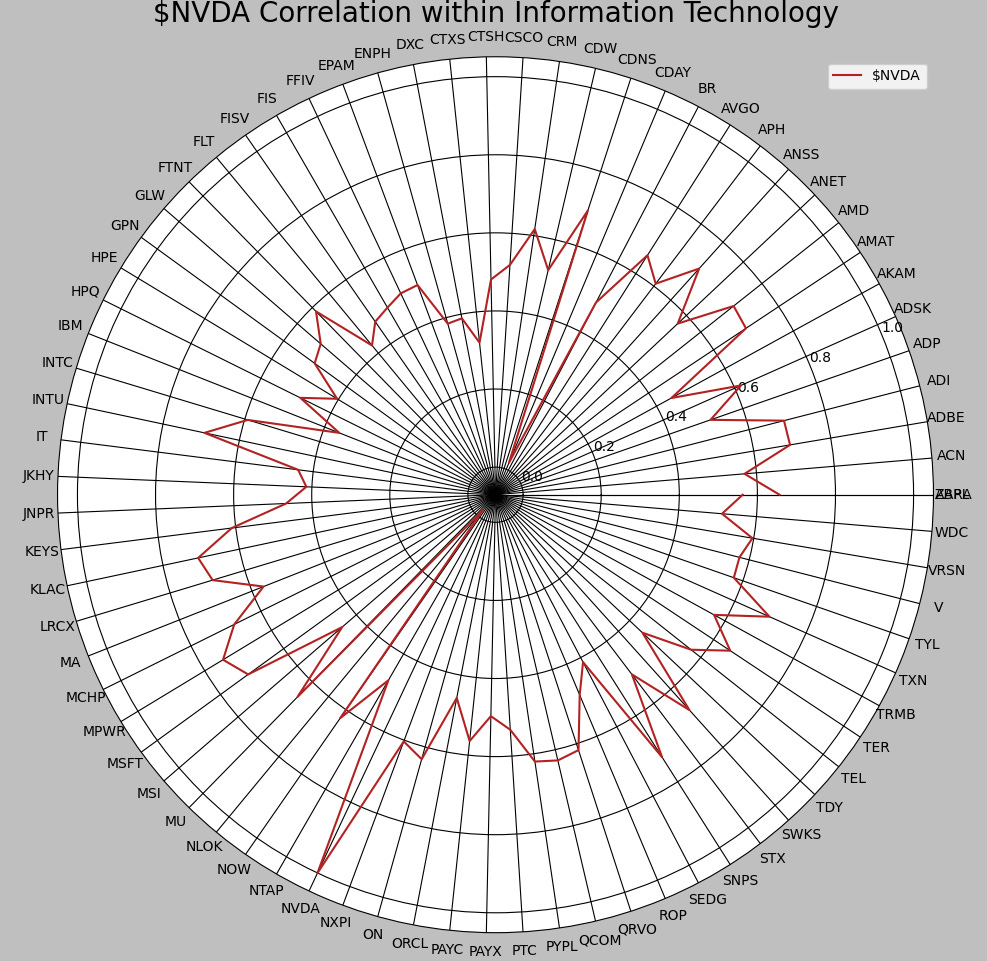
Even though we could get a first impression of the correlation between the stocks in the cumulative return chart presented above, this radar view offers a more accurate view.$CDNS, TXN 0.00%↑, S 0.00%↑, MPWR 0.00%↑ , and a few others show a high correlation with $NVDA. These are valuable information when you build a model or a Portfolio.
The average correlation between NVDA 0.00%↑ and the other stocks is 0.55, and the 1-standard deviation is 0.14. I expected a higher correlation, but I can't argue with it. I interpret this as opportunities within the Sector at given times. Now, the game is to find these opportunities...
Weekly returns
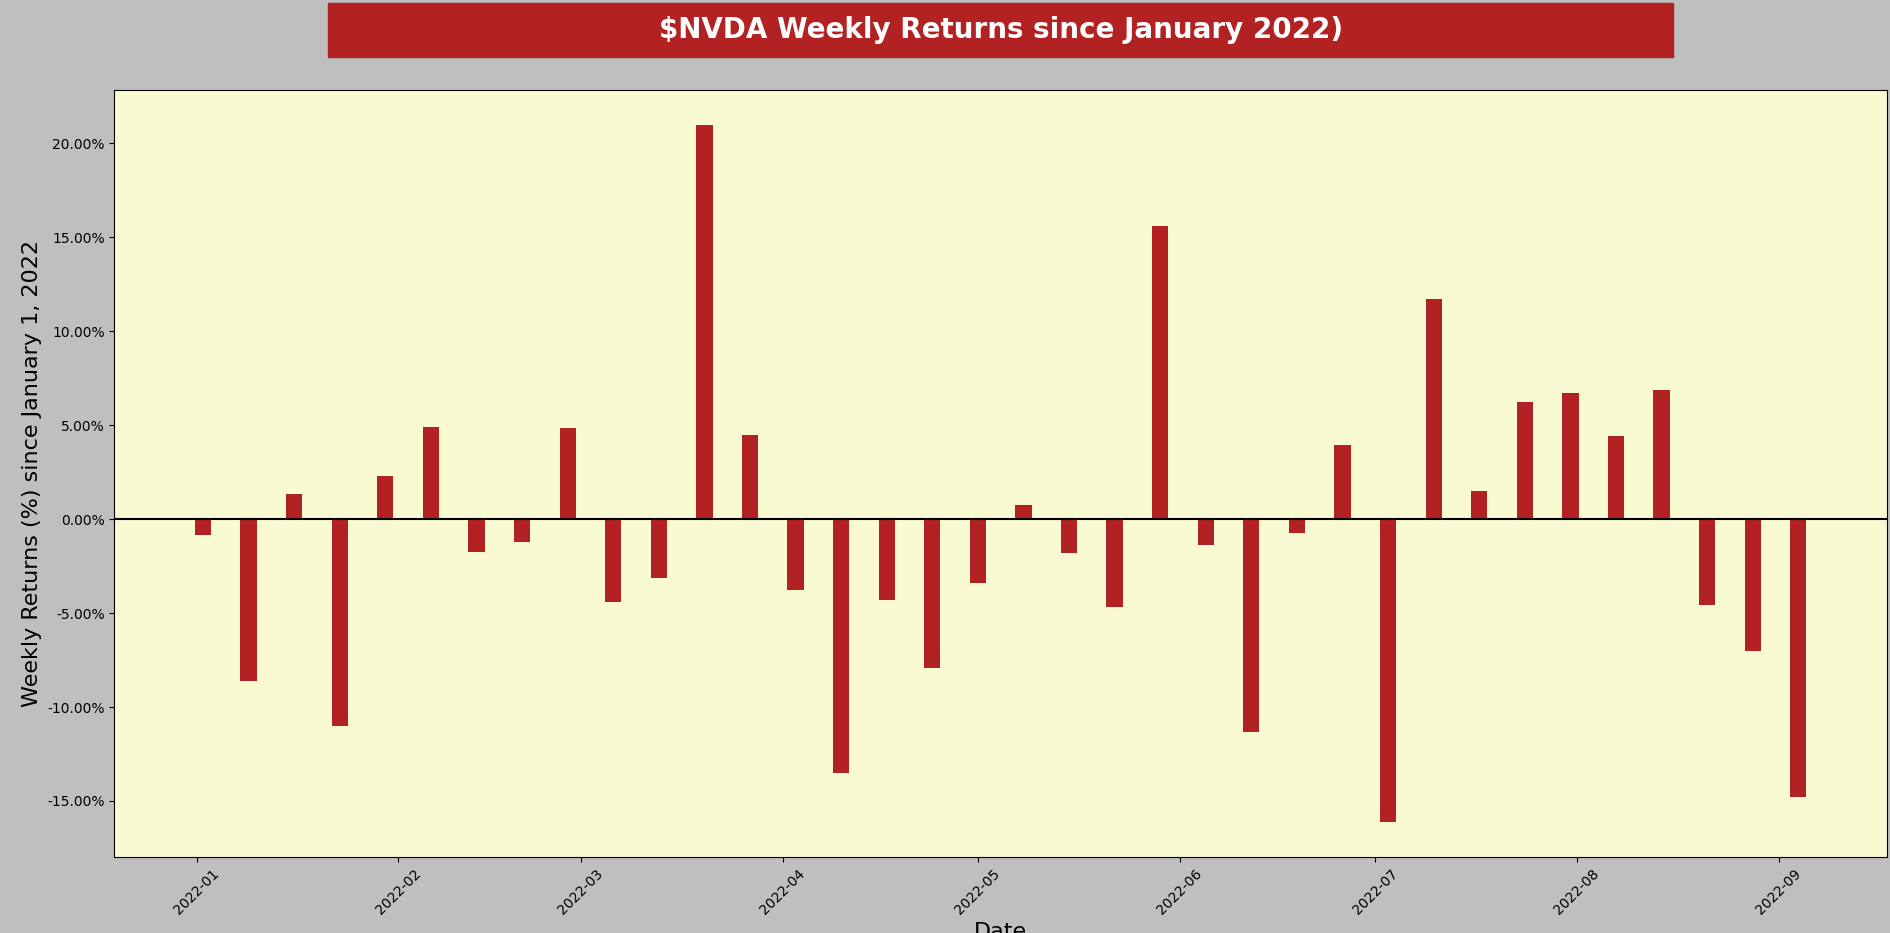
I like this view a lot. Shows clearly the volatility, trend, and strength of the current movements.
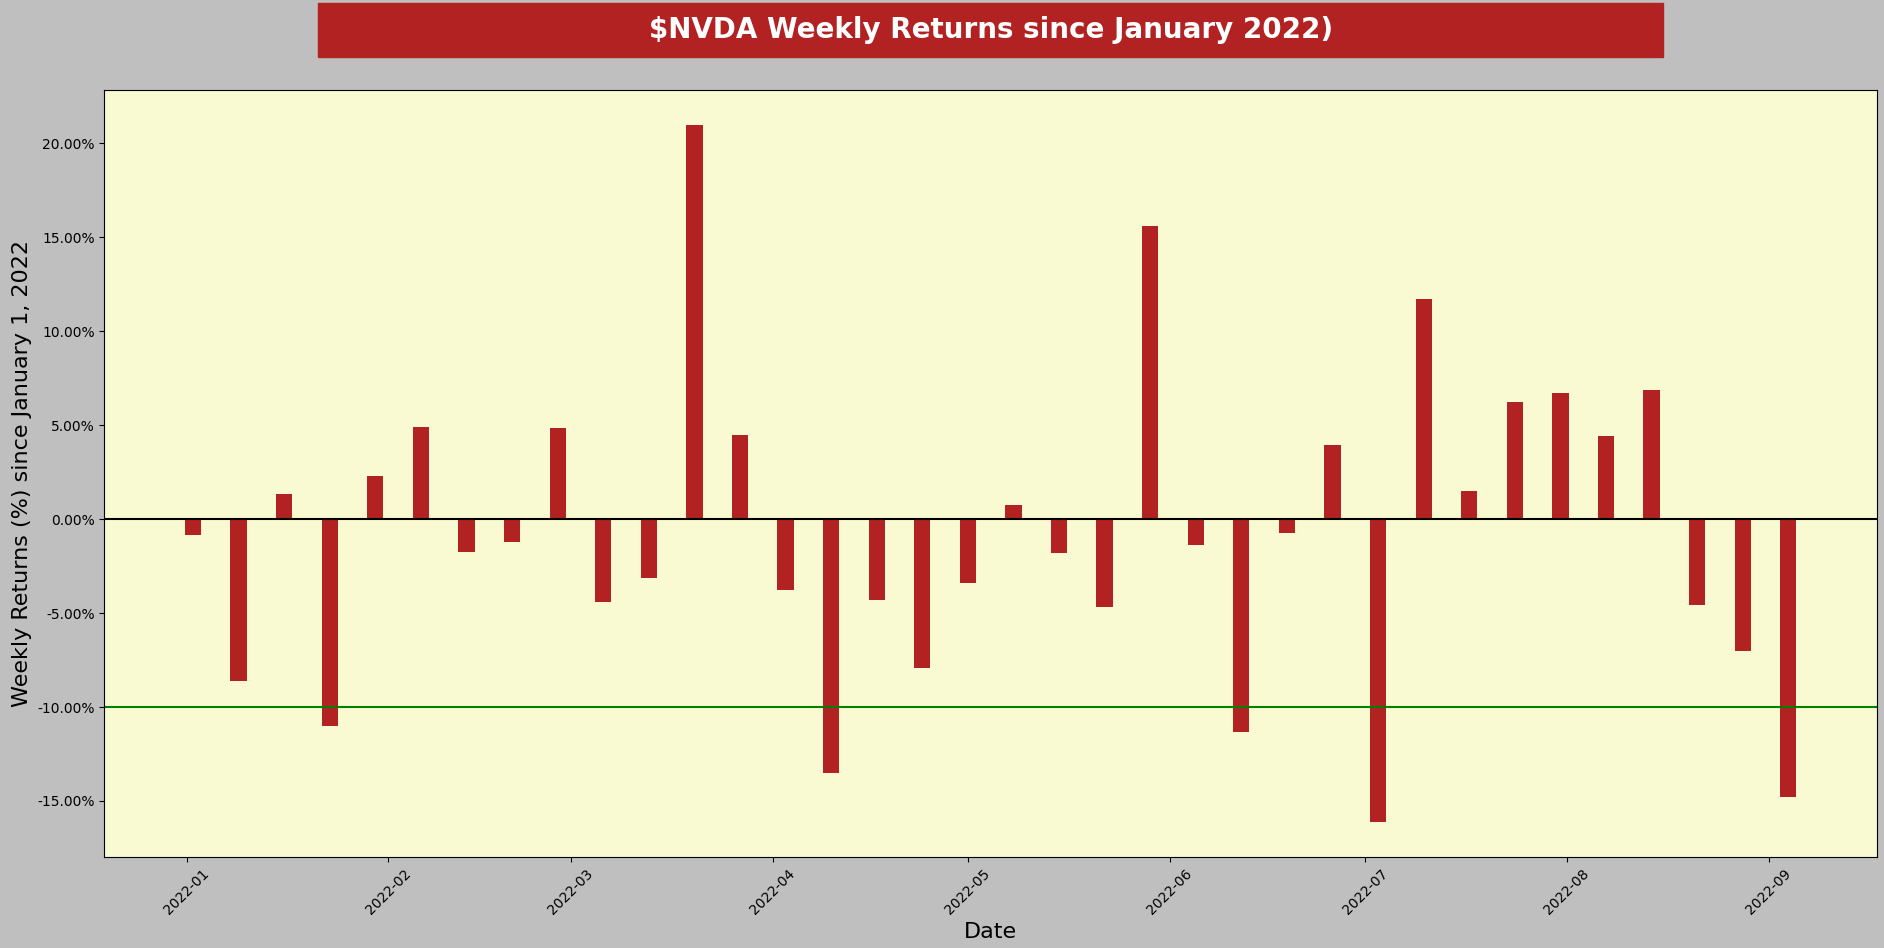
There have been five weeks this year with weekly returns below -10% (!). This week is the second worst of the year.
It doesn’t take a genius to see that the following week offered better returns than the five samples we have this year. Please, don’t be like that person on Fintwit that concludes out of N=1 datapoint.
Let’s try to increase our sample size and look at the same chart, but this time, since January 1, 2018.
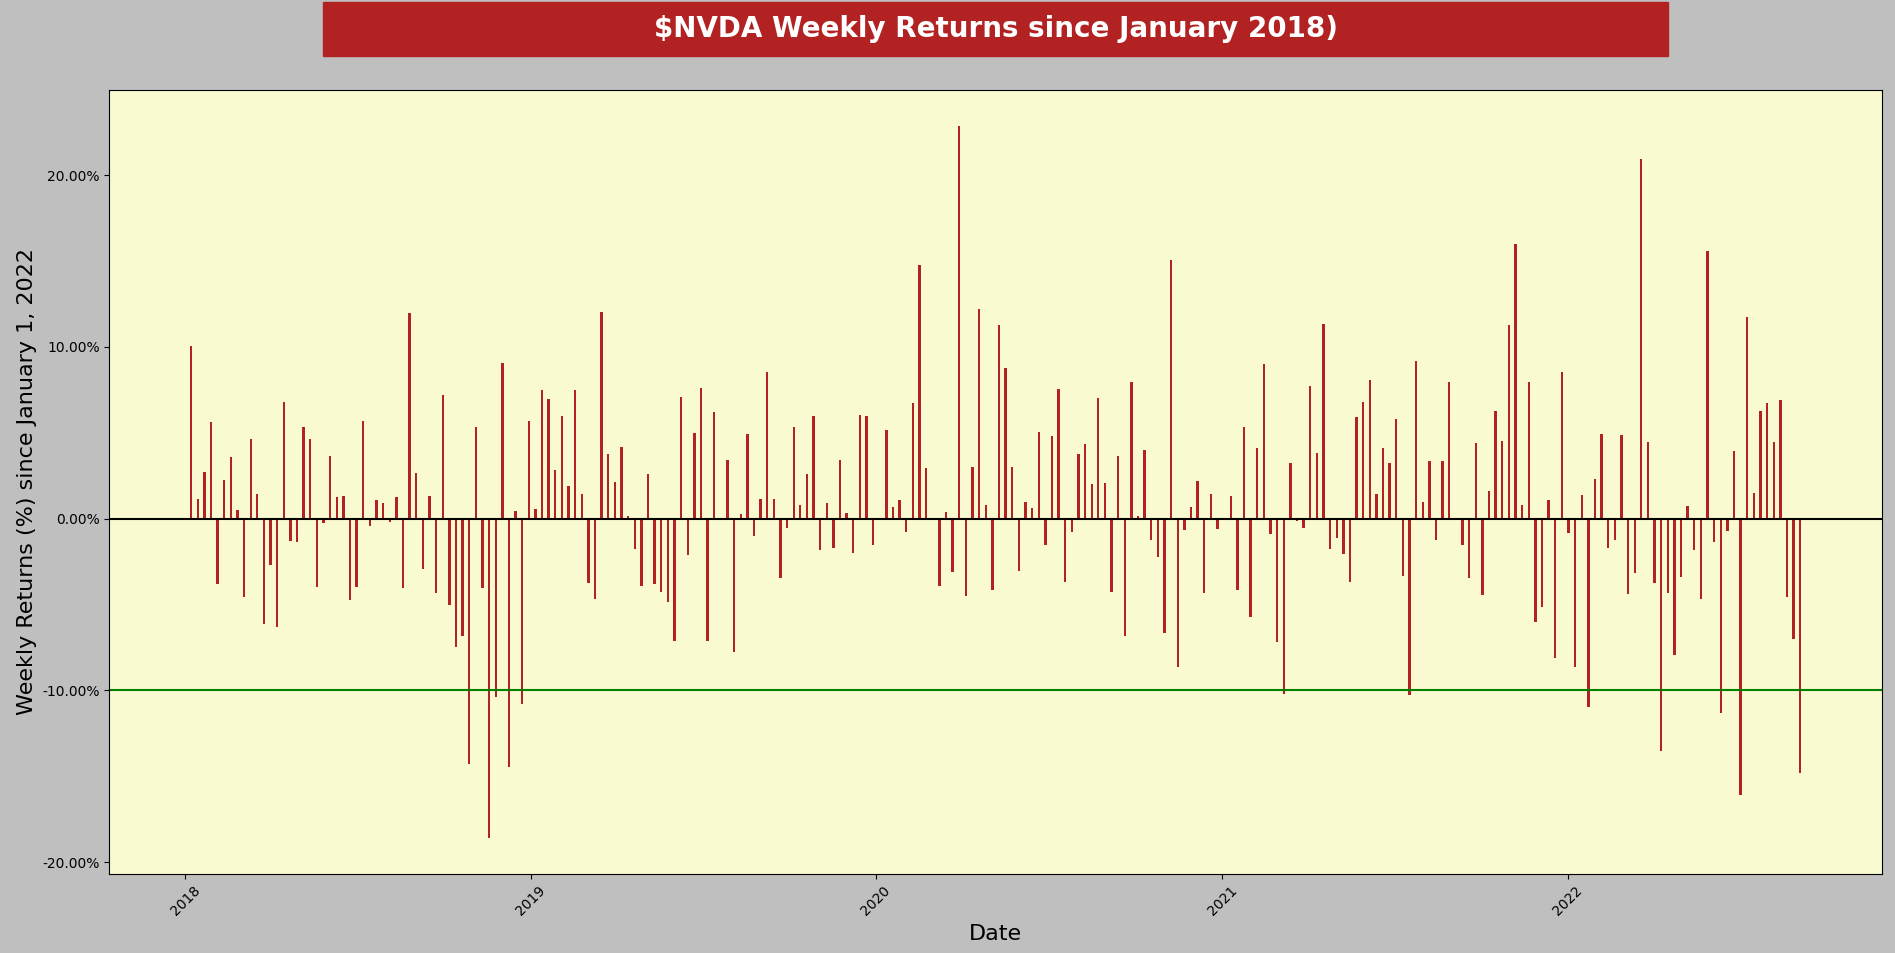
12: That’s the number of occurrences we have now. Interesting to see that almost half of the worst weekly returns in four years occurred this year.
Except for one occurrence in 2018, every weekly return below -10% was followed by a significantly improved return. It’s also interesting to note that the best weekly return since 2018 was during Q1 2020… Rings a bell?
But now, how do we quantify the returns following a bad week?
Statistics after a weekly return below -10%
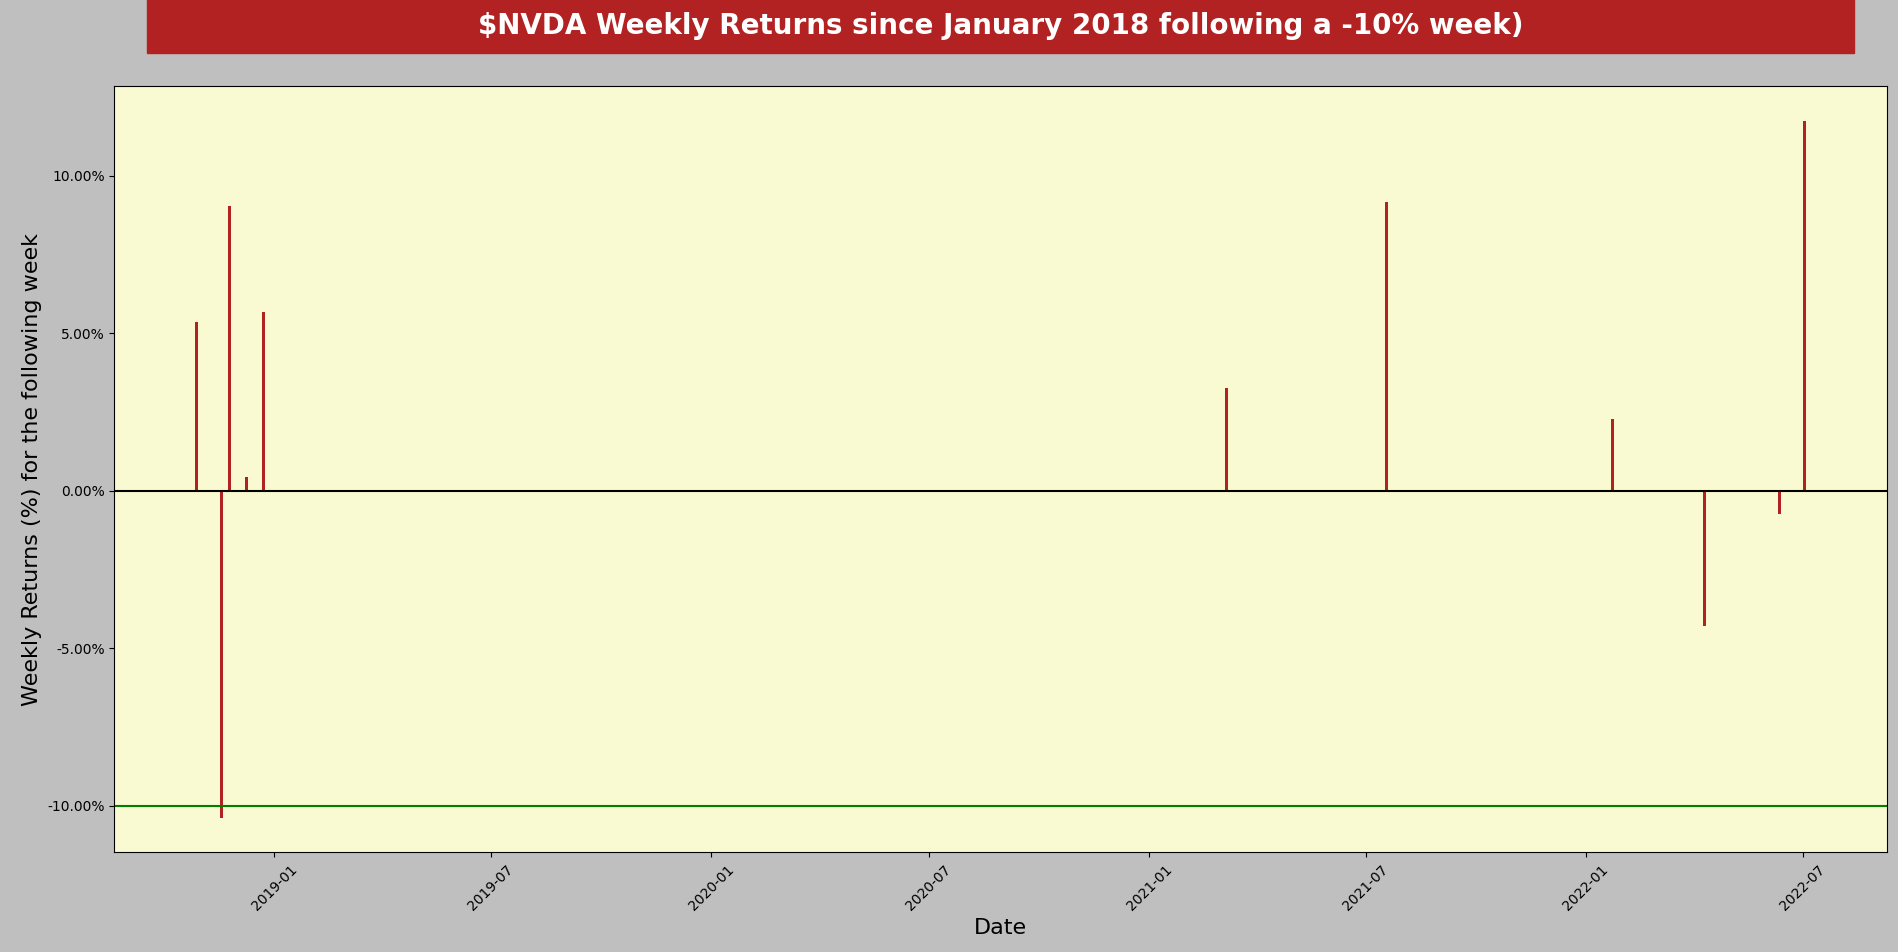
Only one time did we have another -10% week following a -10% or worst week in almost five years.
The average return is 2.86%, with a 1 standard deviation of 6.15%. Pretty volatile, innit?
However, this is still NOT enough datapoint to be able to conclude. What I do for my models is getting this type of information at a higher level. For instance, grouping stocks with a high correlation to have more meaningful results.
Anyway, I find this module of Alfred cool, as I have to enter the name of the ticker, and it will automatically generate a report with all those graphs (and many more that I don’t share).
Bonus: Building your ideal trading partner @Alfred
Everyone talks about how trading is a lonely game, and it is. Believe it or not, I don’t feel that way anymore with @Alfred. It’s not fully automated yet, as I have to get my data manually, but I’m on the right path to getting it fully automated in the next two months. There’s no rush, I’ve been working on this for a very long time, and it’s rewarding to see that my creation is about to go live.
It takes time, dedication, and sacrifice, but imagine trading with a console next to you that gives you a live probability of the following setup based on your backtests.
Or maybe I’m just weird… :)
This weekly Letter is free and is read on average by a thousand traders every Sunday. Last week, I went on a brief rant, and you shared my work more frequently than usual. Thank you. If I see that people read every week but don’t share or interact, I’ll just share my work with a smaller group of people who is interested in it.
See you next Sunday.
- Retail

Caveat: These are my data and calculation, so please do your research.
Promotion: Looking to trade futures too? You can get funded for less than $100 with Apex. If you want to try the Apex Funded programs, you can use my affiliate link here with my 50% coupon code: RETAILCAPITAL, which will always apply the best available promotion.
Apex is a community of traders founded by Darrell Martin, a rancher and day trader who has built a thriving community of traders into over 30,000 members in over 150 countries since 2008.
I’ve written code for over 20 years and I still love it. It’s a great skill professionally and it’s just a lot of fun. I usually work an hour or so in the evening on a fun project after programming for “real job” all day.
I like the correlation radar chart you have here. I’m going to steal this idea! Nice!
Good article
I’m trying to wrap my head around programming (be growth minded) but you are getting it for sure bossman 👍🏻