

Are Fridays greener than the other days of the week?
Are Fridays greener than the other days of the week?
Season 2, Episode 2

In today’s episode, we’re going to do something fun. We will look at the potential seasonality per quarter and day of the week. Isn’t that fun? Maybe I have mental issues.
"Believe you can and you're halfway there." — Theodore Roosevelt
If you missed the previous episode, it’s not too late! It’s going to be an ongoing series over the Summer. And remember, if you want the code, share this article. Word of mouth has been great for this Substack, and it blows my mind that there are so many readers. Thank you to all of you, even the most silent readers that keep coming daily.

We want to know:
What’s the average return for each day of the week; and
What’s the average return and standard deviation per quarter.
Seasonality per day of the week
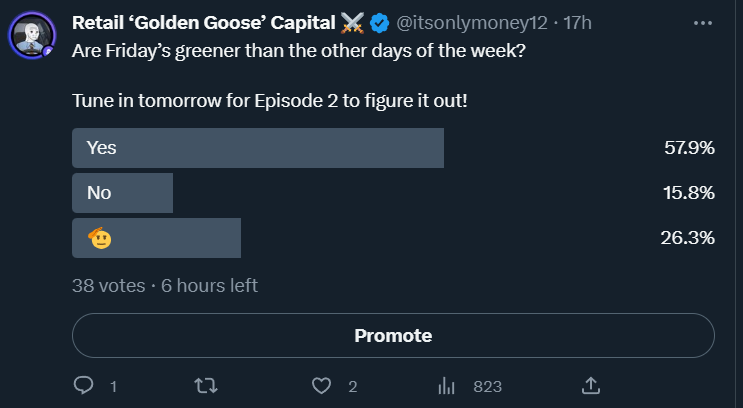
Yesterday, I asked you if Fridays are greener than the other days of the week.
58% think Fridays are greener.
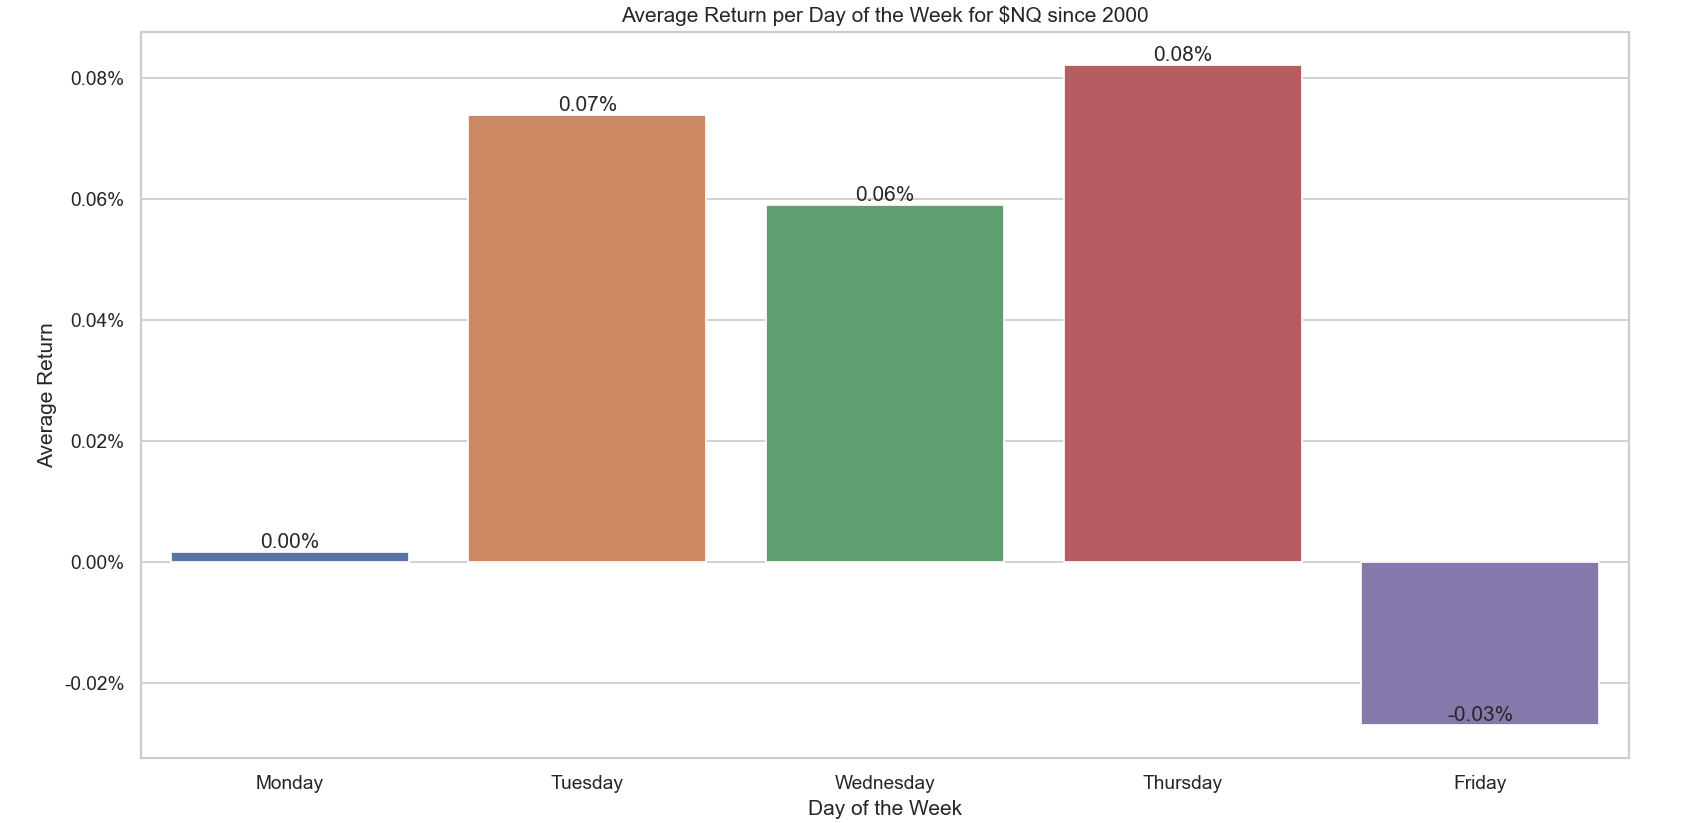
Let’s figure it out. I calculated the returns per day of the week since 2000 on $NQ and did a simple average of all the returns on Fridays. Here are the results:
Observations
Friday is, on average, the worst day of the week, with a mean return of -0.03%.
Monday is the most neutral day of the week.
Tuesday to Thursday are pretty similar.
Once again, the crowd was wrong. This is a simple exercise to do.
However, this doesn’t give the full picture. Maybe Fridays are the days with the most trends days. We’ll look into that in the near future anyway.
Apex runs a 90% promo until tonight, you can grab a few accounts for less than 20$ each.
Seasonality per Quarter
Last exercise of the day… we do the same but per quarter. Attention here, you now have to group the day per quarter, calculate the returns, and then do the average of each quarter.
Is the Santa rally a myth? Are we expecting a higher average return in Q1 (Jan to Mar) or Q4 (Oct to Dec)? Here are the results:

The violin plot (bottom chart) shows the distribution of returns per quarter, providing insights into the range and density of returns.
Q2 and Q4 are the big winners! There are a couple of substantial negative returns that look odd, though. I checked against the graph, and 2000-2002 had some pretty bad quarters.
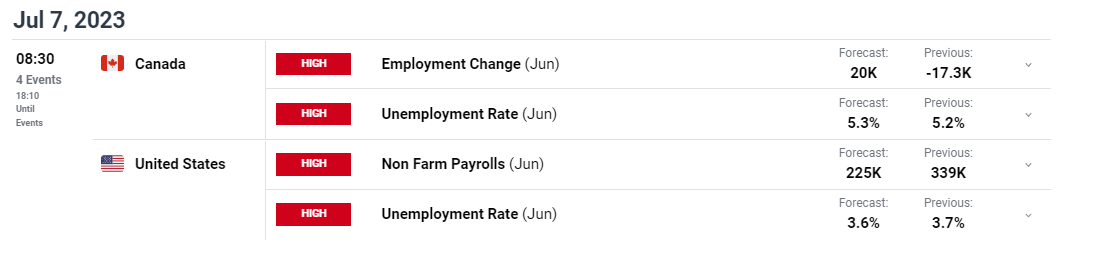
PS: Don’t forget the economic calendar tomorrow morning!
Here is the code… :)

In the next episode, we will look at the volatility per day of the week, month, and quarter.
I hope you enjoyed this article.
— Retail
Maybe it would be interesting to reduce the field and cross the analysis with othe data filter factors.
Just an idea : Are Fridays of last week of the month greener than the other fridays (earnings) ?
What do you think ? I think what you did is a good start but I'm curious where we can push this what would emerge with other filter factors :)
Another Idea : Let's say July is on average a green month, are the fridays of july greener than the fridays of Juni, for example.
It's indeed fun, no mental issue, or you're not the only one with this issue.