

Backtesting with Python: Market Seasonality
Backtesting with Python: Market Seasonality
Season 2, Episode 1

Happy 4th of July to my American friends. Happy Tuesday to the other 99 countries reading this article (!).
My father used to say that it's never too late to do anything you wanted to do. And he said, 'You never know what you can accomplish until you try.' — Michael Jordan
Many of you asked for a return of the Python series, so here we are! Today, we’re going to work on market seasonality for $NQ. This will be an ongoing study case over the Summer to create a predictive model, and this is Part I, where we build everything from scratch.
If you ever wanted to learn Python for Trading, this is your chance.
Market seasonality refers to the tendency of financial markets to exhibit consistent patterns of demand and production over the calendar year.
I do not actively use this for my trading, but it’s good to at least be aware of it.
Apex runs a 90% promo until this Friday, you can grab a few accounts for less than 20$ each.

How to do it?
Whatever you try to achieve, it’s always easier to decompose it into smaller and easier problems. That’s the only thing I learned in maths school that was really useful.
Get daily data from the yfinance API with Python since 2000;
Resample the daily data to monthly data;
Calculate the monthly returns per year;
Calculate the average monthly returns over the years;
Plot the charts.
If not clear, ask your question in the comment. I don’t (often) bite.
Results
The top graph shows the average monthly returns since 2000, and the bottom chart shows the cumulative average since 2000. Up only. Always.
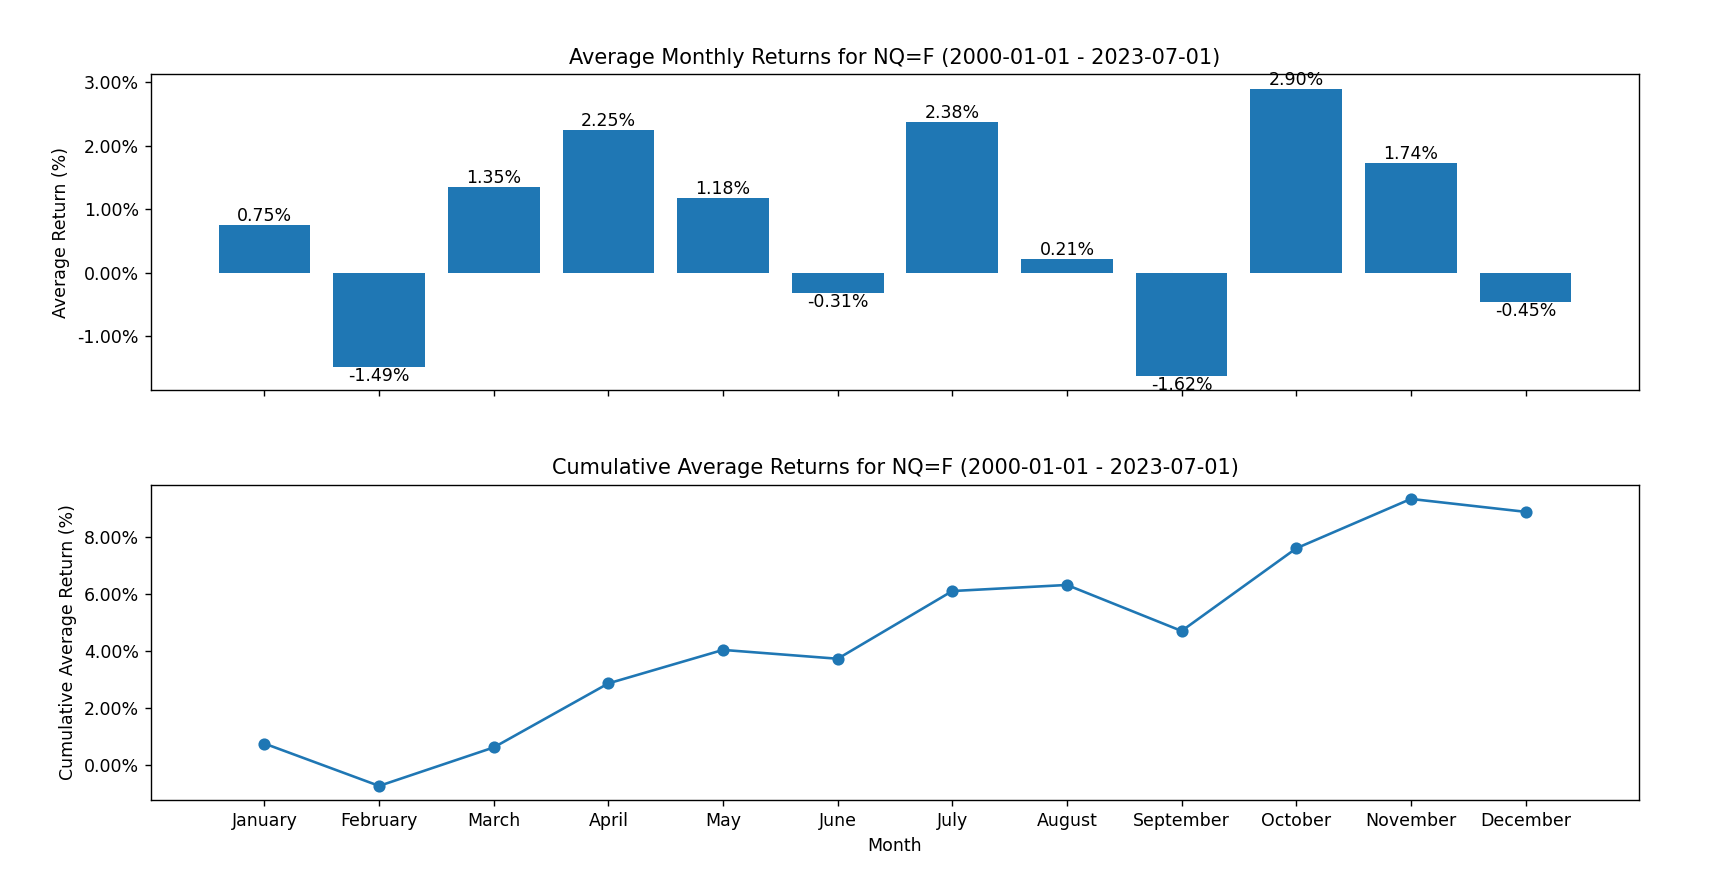
Observations
July is, on average, the second-best performing month after October.
August is usually flat.
September is usually red (-1.6%).
Overall, it goes up to the right (yes, I have a PhD).
Conclusions
Why shorting, right?
I’ve seen this graph many times, and I’m always surprised. When the market’s behavior is skewed to the long side, why even bother shorting? Seriously. (I know I already said it just above, I’m not completely senile yet.)
The code (end of this article) can be used for any assets. Not sure why it’s in the conclusion section.
Summertime is a different type of market. It has been slightly different since Covid, but before that, it wasn’t the best time to trade. As usual, I invite you to do your own research. The code can be tweaked to look at this curve per year.
Additional work could be done to couple the above based on the YTD returns or current volatility to make something more flexible. This is how you can start building some simple directional models. I highly encourage you to give it a try if you’re interested in this.
In Episode 2, we will look to see if the previous month's return has any impact on the current month’s returns.
In episode 3, we will then do a deep dive into the returns around holiday time.
Python Code
If you’re interested in getting the code, simply retweet/quote my tweet about this article on Twitter, and I’ll send it to you in a private message (make sure your messages are open).
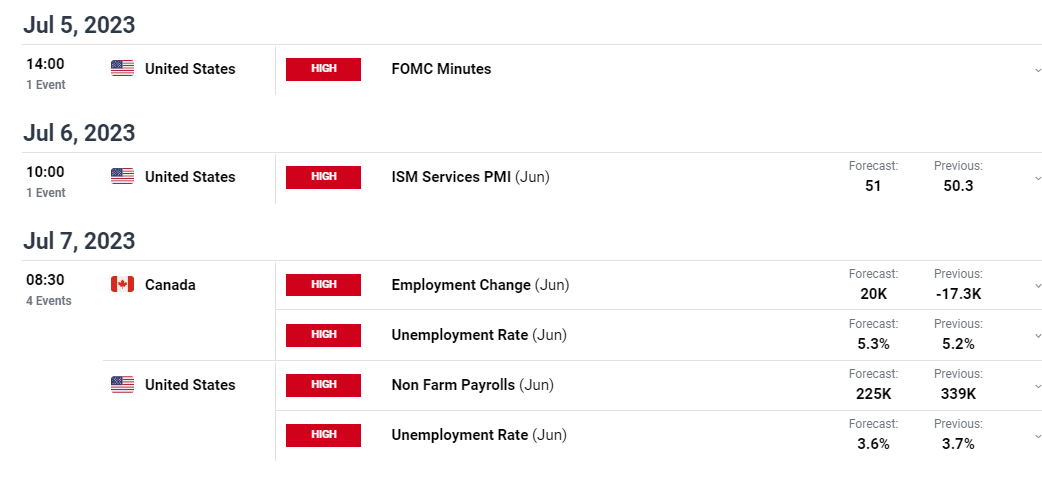
Additionally, you’ll find below the economic calendar for the week (high-impact news only). Be careful with your trading; the market is going on up only mode. Try not to be too stubborn.
I wish you a great day. Be kind. Spread love.
The world needs it more than ever.
— Retail
ser, i dont see the tweet to this article on twitter. do u have a link to it? happy to retweet.
Waiting for the tweet 😋