

Seasonality & Stats with Python
Seasonality & Stats with Python
And Weekly Market Prep

Happy Monday, lads
Ready for another trading week?
I indeed feel refreshed after my weekend at the beach. A lot of fresh air, long walks and (of course) some great French food. Surprisingly, I’m looking forward to the rainy days and cold weather, an excellent excuse to spend some good time by the fireplace watching the Harry Potter movies again. I hope you all had a great weekend.
SHILL CORNER
Without more wait, here’s the weekly prep. As usual, we start the economic calendar. As you can see, it is a heavy week for our European friends, which will most likely impact NQ, especially since the news will happen during the London session. Other than that, except today (Monday), we have a red news each day of the week, and even two on Friday.
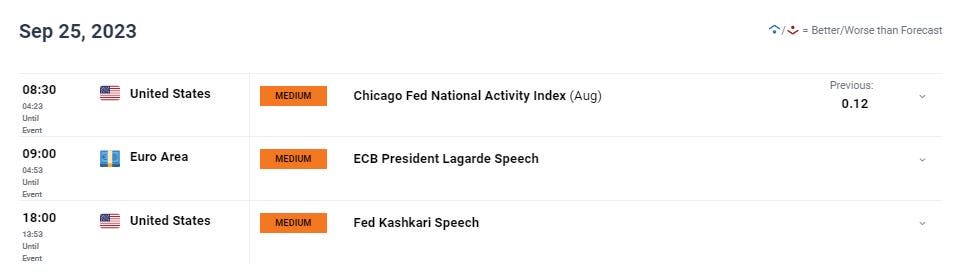


The more red news we have weekly, the higher the chances for a trend day on Thursday/Friday. As usual, don’t take my words for granted and do the analysis; I might be wrong.
If we look at the daily view on NQ, we’re back at the bottom of the range we’ve been in since early June. This area also corresponds to where we did most of the volume in 2023. People crying for new ATHs or new lows… I won’t say anything.

Here are some stats… My gift to you to start the week.
First, some updated seasonality charts. October is (historically) the best month of the year. Is it true?? I guess yes. (I created the code and the charts, so there’s only me to review it, lol).

Now, for last week, how does the weekly return compare to historical stats?

The above histogram is ten years of weekly returns on NQ. Obviously, it’s centered towards slightly positive numbers since this ponzi market has been created to go up by nature. Again, I won’t share too much more than this, but you can see where last week would fall in the above chart and build some statistics from here. It’s quite an interesting and not too difficult process.
The VIX is at the door of 18. We were in the 12s last week. At 18, you can short more easily than at 12. There are more opportunities. (Meaning more opportunities to get fucked as well). Factor this in your preparation.
This statistical analysis plays a big role in my everyday approach to the market. And it’s not that difficult to start (of course, some work needs to be done). I can help you with that, even with as little as 2 hours of call.
Finally, let’s talk about rotation and market structure.

The Volume Profile from last week shows two apparent distributions from 15250 to 15450 and 14850 to 15000 (I’m rounding numbers). We have a no-mans land between 15020 and 15250 (except for Wednesday’s low during FOMC). I think this top distribution from the prior week is very important and will give a lot of clues when we revisit it for the next move. We built a lot of volumes there during the previous RTH sessions, followed by the sizeable post-FOMC drop.
I’ll keep in mind these HTF rotations for my daily trading. I’m not giving you the full picture on purpose. If you want to continue this prep, go back in the past and look at the previous rotations below 15000 to understand the upcoming ranges better.
I will probably write a mid-week update on Wednesday and stick with this schedule if you guys enjoy it.

I’d appreciate it if you could share this article; maybe there’s still a chance for this Substack to reach 5,000 by the end of the year. I won’t be able to do it without you, that’s for sure.
Cheers,
RC