

MORE RED TO COME

Picture this, the market just dropped 3%, your P&L looks as sexy as your wife after 30 years of marriage, you gained some new grey hairs, and now you’re wondering, ‘what the hell will happen tomorrow?’.
Are we going to have a range day, a continuation of the current down movement, or a big green dildo?
While this is a common question, you should be able to answer it. If you haven’t done your homework yet, I have good news for you; we’re about to do the analysis right now!
Grab a coffee or maybe an aspirin, and get ready to work.
This analysis has been done on the great Nasdaq through Yahoo Finance API.
I hope you’ll enjoy the read as much as I enjoyed writing.
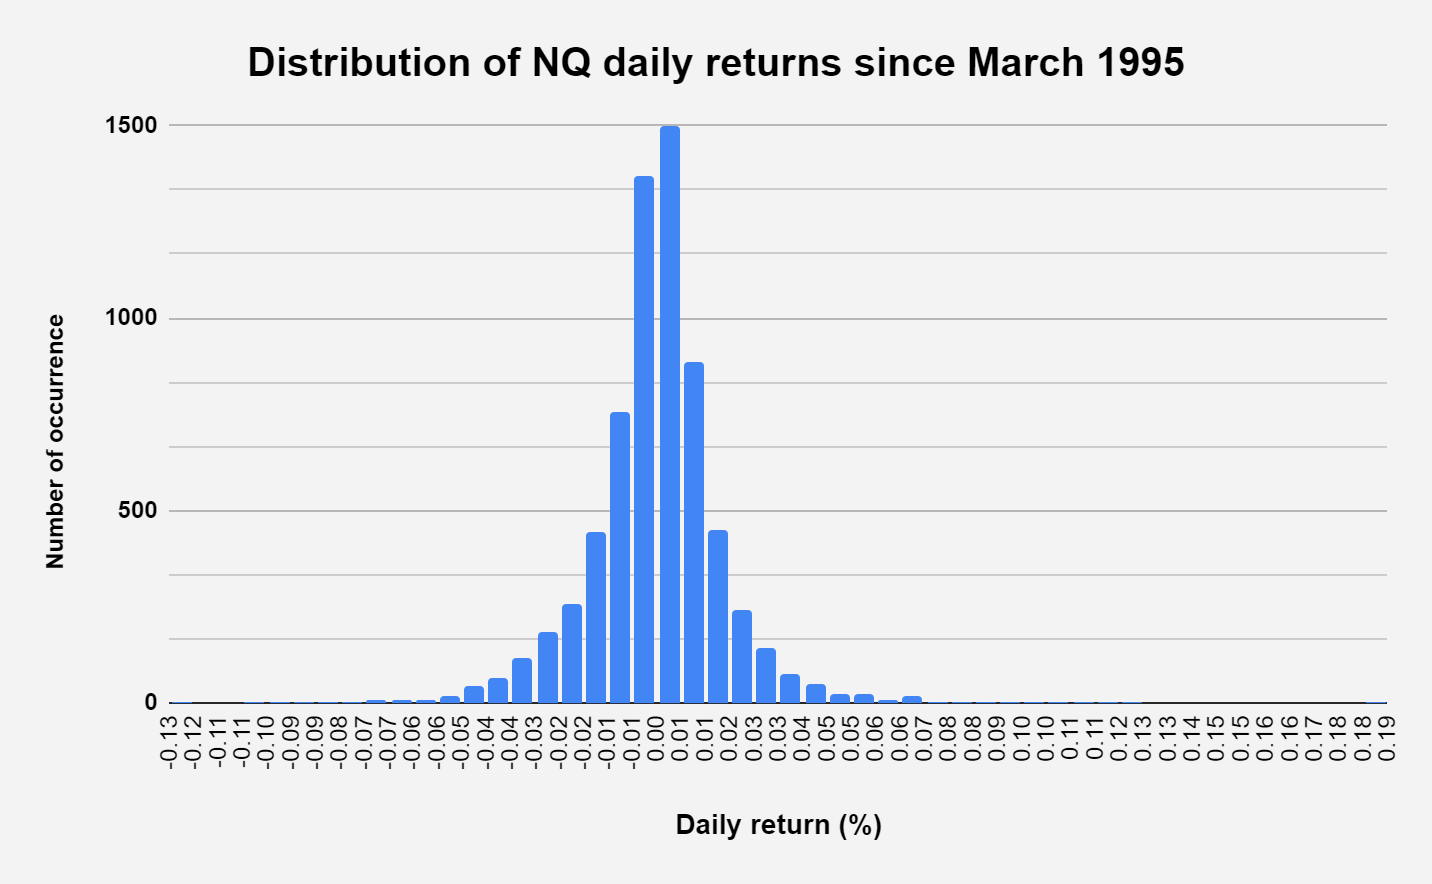
Distribution of daily returns since March 1995
The daily returns almost follow a normal distribution
Before answering what happens after a big red day, let’s try to measure what is considered an abnormal red day.
The above chart is a histogram representing the distribution of Nasdaq’s daily returns since March 1995. As one can see, this looks like a normal distribution.
If you’re unfamiliar, a normal distribution is a mathematical type of continuous probability distribution. I would suggest you read more on Wikipedia; this will be useful, mainly if you use the Volume Profile, to understand the concept of the Value Area.
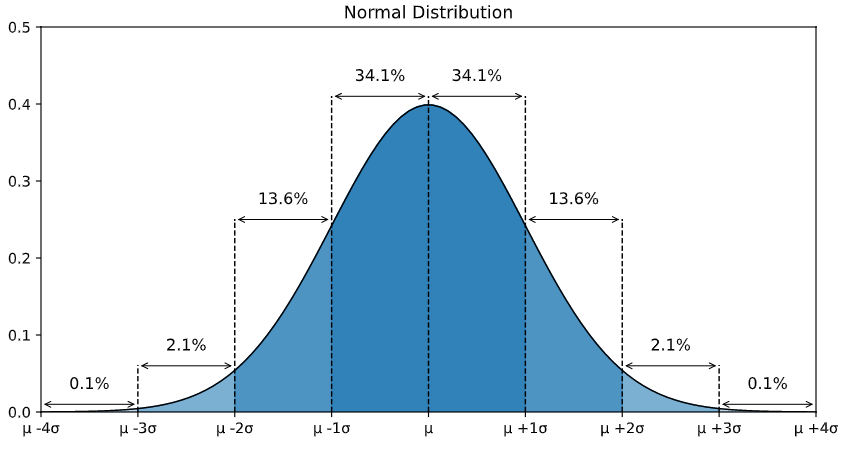
FYI - this is what a normal distribution looks like.
What is considered a big red day?
Hello, my friend Percentile
I have ranked every trading day on the Nasdaq since March 1995, and I’ve looked at the return of the 5% worst days. In other words, out of 100 trading days, what are the returns for the five worst days in that sample?
For those of you who are interested, this is called the 0.05 percentile.
It’s a very powerful function that lets you quickly grasp key thresholds in a series of numbers.
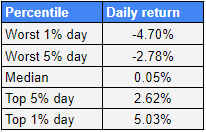
Since 1995, a day with a return below -2.78% (let’s round it to -3%) is considered in the 5% of the worst day.
My first reaction looking at this is that -3% red days happen more often than I would expect. Five days out of 100, we have a -3% red day, or once a month.
Key points from that table
The returns are skewed towards positive returns: the best days have higher absolute returns than the worst ones, and the median is also positive.
50% of the trading days since 1995 have a return at least equal to or above 0.05%.
2 days a year (on average) we see a -4.70% red day.
2 days a year (on average) we see a +5.03% red day.
I find it useful to have those statistics in my mind, especially during volatile times. It helps me keep the bigger picture and trade more rationally.
What happens after a -3% red day?
I know you’re here for that answer, don’t worry, you’re almost there
Ok, so now that we’ve paved the foundations let’s look at the market’s reaction after such days.
I’ve been looking at the returns of the day following trading days that close at least 2.78% in the red. And the results are quite interesting.
Key statistics
357 days out of 6735, we closed below -2.78% (or 5% of the time, ok no big news here that was expected, but it’s always good to double-check our results).
0.50%. This is the average daily return of the Nasdaq since March 1995 on a day following a -2.78% close or worst.
Since 2010, we don’t have as many -3% days as we used to have between 1998 and 2009. The market has changed, and that’s your job to do your homework to adapt and survive. It means that ten years from now, the market will probably be different from today. I personally like to update my statistics at least once a year.
Now, does that mean one can just buy the dip at the close of a red day and come back the next day?
Let’s look at this in more detail.
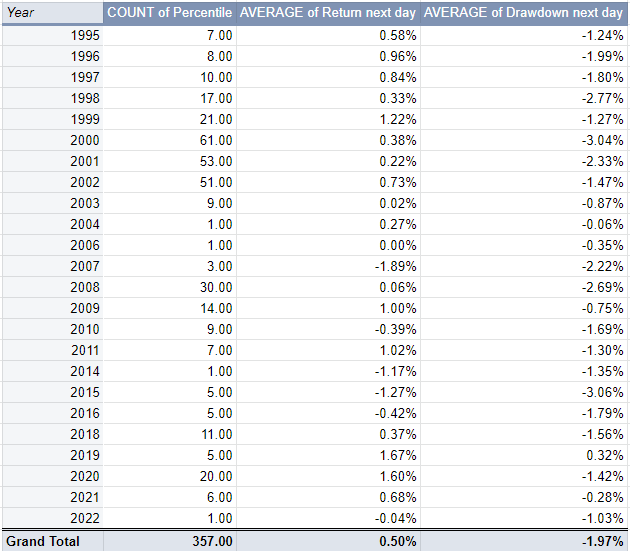
I’ve gathered the details per year for each of these days.
Even though the average return is 0.5%, there is a bigger potential, on average, for being short.
-1.97% is the average low a day after a -2.78% red day. Sure, it then retraces and closes in the green, but I find it fascinating that the market still goes almost 2% lower FIRST.
This is how I build my strategies.
100+ sample size.
Asymmetric risk-reward ratio.
Simple to understand.
Consistent over the years.
I’m obviously not sharing all the details of one of my strategies, but there are many ways to go further in this analysis by looking at other key metrics.
I hope this post helped you to understand how to look at numbers and get an edge on them. If you want to learn more about my style, you can watch my series of videos here. Use code RETAIL for 20% off for the first 5 to get it.
Stay safe.

PS: These numbers go up to 2022. I hope it gives you enough ideas and energy to get it started on your own.
Whew! I was worried that we just might get 2 down days in a row. Can't be having that as it might cause the Fed to step in and bail out the markets.
Big Green Dildo!!!!! Fuckin Priceless Bro!! 😂🤣😂🤣
I’ve learned everything now