

📊I Build a Trading System Step By Step With You using Python
📊I Build a Trading System Step By Step With You using Python

“Nothing is impossible. The word itself says ‘I’m possible!'” " ~ Audrey Hepburn
Introduction
Dear Traders,
Too many of us are or have been lost in the Fintwit metaverse, seeing crazy P&L (that are probably fake btw…), jumping from one method to another, constantly looking for the holy grail, to end up, month after month, at the same uncomfortable spot of constant inconsistency.
Even though it can be intimidating at first, I highly suggest that you try to build YOUR trading strategy. At least, if you lose money, it’ll be from your creation. Jokes aside, there’s no better way to learn than by doing things yourself. This is what I will try to share with you today.
The first edition of my educational series was a success, with more than 6,000 views. This remains free, as I enjoy sharing the few things I’ve learned over the years and giving back to the community. “Pay it forward.” My goal is that by the end of this article, you’ll get the following takeaways:
Where and how to start building a trading system
How to look for new strategy ideas
How to test an idea and see if it could be profitable (concrete example)
Programming is not that hard
There is NO need to be familiar with Python to read this article. Take your time to read it, take some notes, and try it by yourself.
Note: If you read this in your email app, the article is too long, so you’ll have to switch to click on “view entire message” at the end of the email.
Caveat: None of this is financial advice. I write out of passion, and you are responsible for your actions.
Grab your favorite cup of coffee, and let’s have fun.
Where and how to start building a trading system
Trading system. Trading Setup. Trading Strategy…. So many different ways to name it. My favorite appellation is the first one. But what is a system?
System ˈsistəm: a set of principles or procedures according to which something is done; an organized framework or method.
There are multiple ways to start building a trading system. So where do you start?

Understand why you want to build a trading system
Collect data
Analyze data/trading system
Draw conclusions
Understand why you want to build a trading system
What is your why? Why do you want to build a trading system? For me, the answer is pretty simple. I want to be able to test the validity of some of my assumptions quickly, and with accuracy. I believe programming provides a solution to my two main motivations.
Collect data
The second step is to collect data. You need data to be able to test your assumptions. In 2022, most trading platforms offer a way to collect data. Google and Yahoo finance are also freely available to gather data. The Nasdaq website offers an API solution for you to get real-time data. You have absolutely no excuses.
I personally use the following:
Google Finance Python API to collect daily statistics that are automatically analyzed at the end of each day. You can find the google sheet here with all my $NQ daily stats.
NinjaTrader data that I download every day to run my Python scripts to update the key statistics on my different trading systems.
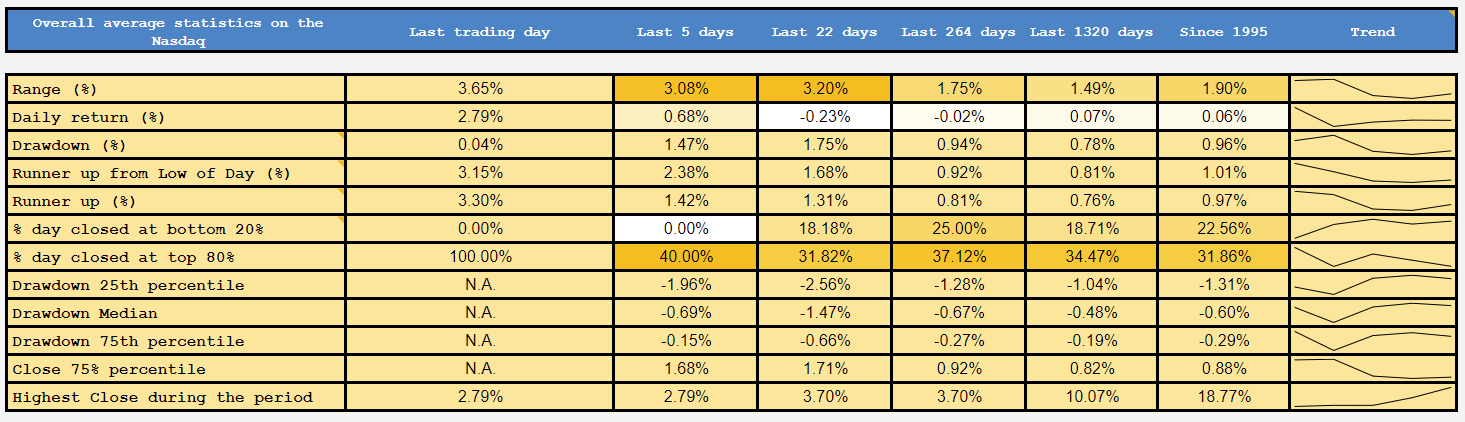
Here are some of the daily statistics I get every day thanks to programming.
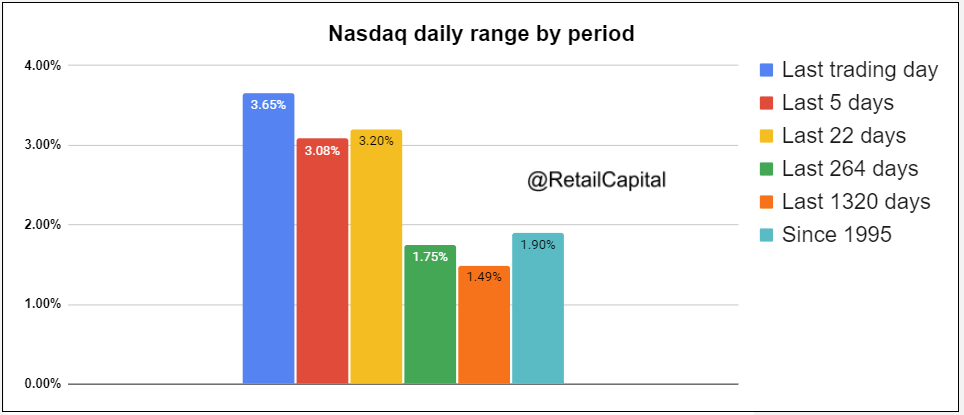
To me, it’s helpful to have a quick look at those before the start of my trading day to help me make educated decisions.
Analyze your data/trading system
Now that you have your data, organize them in a systematic way, and start building statistics on anything you want to test/monitor. To test the validity and robustness of a trading strategy, I look at the following:
Number of trade (sample size);
The ratio of long to short position (to see if your strategy can survive through the different types of markets);
Profit factor;
Max drawdown;
Largest winning/losing trade (we don’t want crazy outliers).
There are many more metrics that can be measured, but these are the ones I like to systematically look at.
Draw conclusions
Once you have analyzed your data, you’re now able to clearly see whether your assumption was correct or incorrect, with measurable variables.
You can tell, based on a sample of data, the frequency of when you would be right, and the severity of the potential winnings and losses. You can tell, on average, what is the winning streak, and losing streak.
How to look for new trading system ideas
To me, there are two different ways to look for new trading system ideas:
Visually look for patterns and then test them with your database (labeled)
Ask your code to look for hidden patterns (unlabeled).

Through this article, we will focus on the first part, as the second one requires some programming background.
If you’ve been looking at your screens for a few months, I hope that you have a few ideas to try. Maybe you’ve heard about that 15 seconds / 30 minutes opening range system. Maybe you want to see if a daily Doji candlestick on a key support level has more chances to lead to the market rallying. Maybe you want to test if a 1-minute candlestick that has an abnormally high volume will lead to a reversal or a continuation of the current movement. Maybe you want to test if a tweezer often leads to a reversal.
Should I continue? I think you got my point. Programming allows you to test all of the above at a speed that is unmatched in comparison with you manually looking at your charts and measuring the wins/losses.
Now that you’re sold, let’s look at a concrete example. Ready? Let’s go!
How to test an idea and see if it could be profitable (concrete example)
I guess this is the part that you’ve been wanting to read since the beginning, so let’s get straight to the point.
Today we are testing the following assumptions:
Is it a good strategy to go long when a candlestick makes a wick below a 4H low?
Visually, this is what it looks like:

Prices quickly dip below the 4H low before closing above.
Is it a good strategy to buy at the close of this candlestick, hoping for prices to rally?
We will follow this simple 5-steps plan:
Presentation of the data
Reorganizing the data
Coding the rules that we want to test our strategy
Measuring the success/failures of the strategy
Draw conclusion
If at any point, it seems too difficult, please reach out through the comment section or on Twitter.
Presentation of the data
We will be using the 1-minute candlestick data on the $NQ, downloaded through NinjaTrader. For our example, the data goes back to March 2022.

Reorganizing the data
With a few lines of code, we can transform the above bad-looking txt file to the below dataset. We also add a column called “4h_low” that will show the current 4H low (excluding the current candlestick). For the sake of the below screenshot, I’ve put a 3-min low in the “4h_low” column so you can easily see how it works (otherwise the dataset is too big to show here).
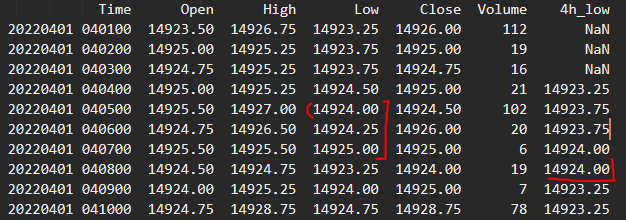
Here’s the code used to get the above dataset.
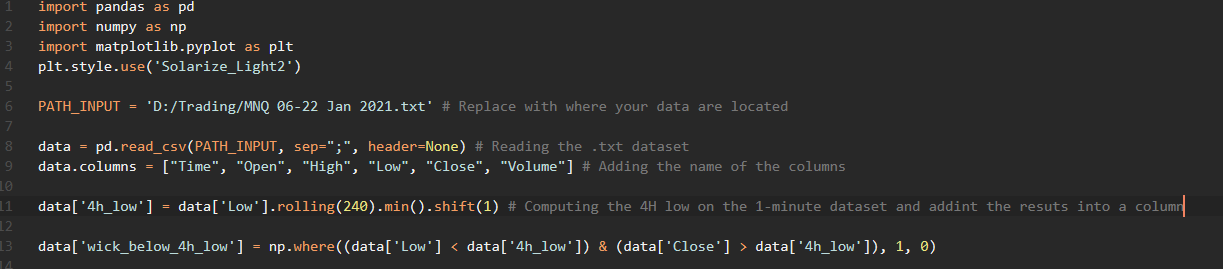
Coding the rules that we want to test our strategy
We first need to tell the algorithm to alert us when a one-minute low is below the 4H lowest point AND closes above it. To do so, we need to use conditional formulas and add a new column that we call ‘wick_below_4h_low’, which will:
1 if the conditions are met;
0 otherwise.

Since March 2022, we have had 75,928 1-minute candlesticks in our dataset. 1,135 of them meet our criteria. 1.5% of the time, the criteria are triggered. Do you start to see how cool programming is? We already know exactly how many times our idea occurred in the past!
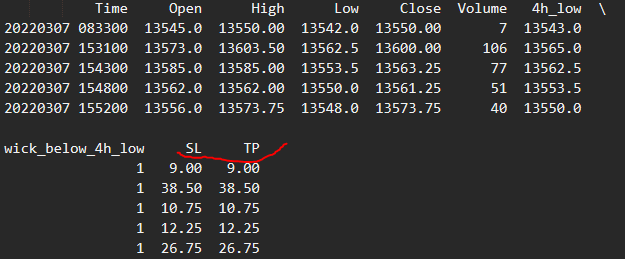
Now, we’re adding two more columns: SL and TP. We decide to start with a take profit that is equal to the stop loss. The Stop Loss has been calculated as the Close - Low of the signal candlestick, plus 1 point to avoid getting stopped out on a retest. This is what it looks like:
Measuring the success/failures of the strategy
Now that we have our TP and SL in place, let’s look at the results it would have produced. If the prices reach first the SL, it’s a loss in the ‘Output’ column. If prices reach first the TP, it’s a win in the ‘Output’ column. If both are touched during the same candlestick, the row is removed (for simplicity reasons - it doesn’t happen too often. For a proper backtest, this should be studied more in-depth).
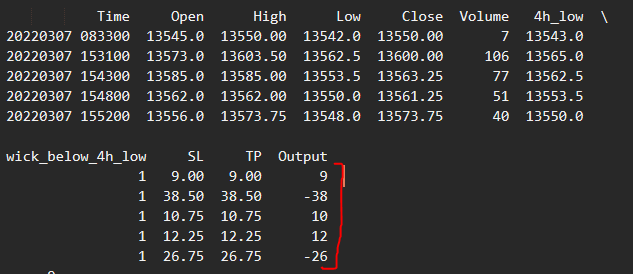
Above is an extract of our new dataset with the result of the first 5 trades in the ‘Output’ column.
Let’s plot the results to see what it looks like.
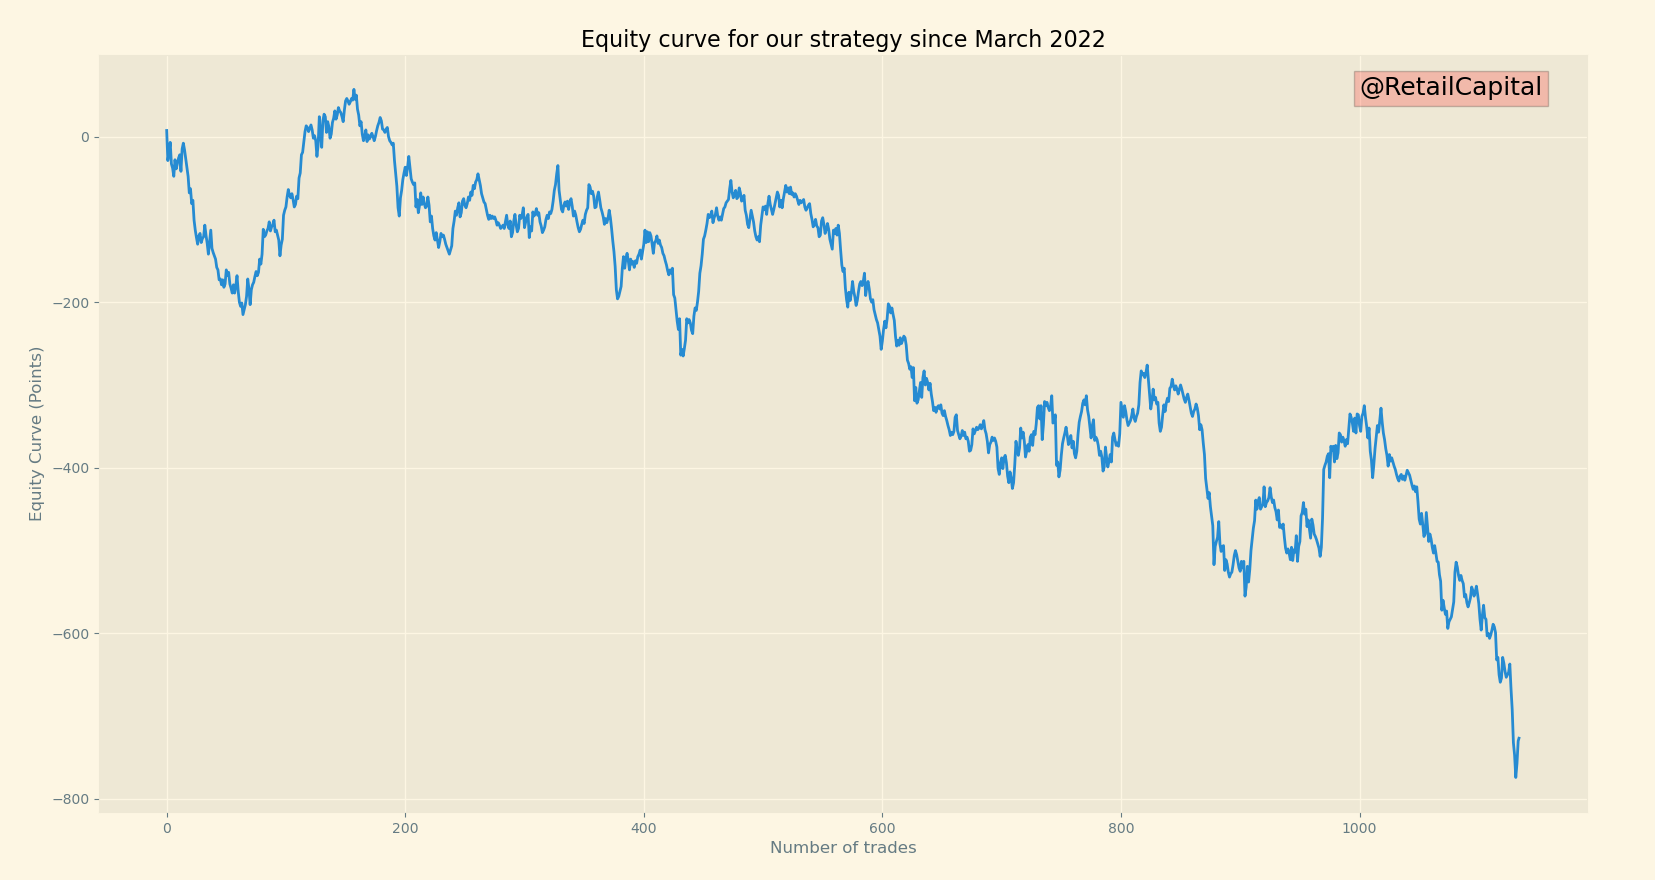
Yikes… It doesn’t look great. To give some perspective, 1 point on the Nasdaq is worth $20, so this would result in a loss of c. $14,500 before commissions (I don’t take commissions into account for simplification reasons, but it’s really not difficult to add them).
Let’s try to understand what’s going on here.
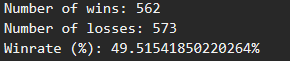
We have 562 winners and 573 losers. Our system wins 49.5% of the time, yet, we lose a lot of money. Weird?
Not really! We also need to look at the average winners against the average losers. You can win 50% of the time, but if your losses are bigger than your winnings, you’re ngmi.
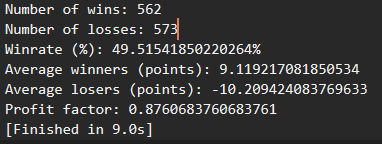
Our average winners are 9.1 points against -10.2 points for our average losers. Maybe it seems like an insignificant difference for you. But over more than 1,000 trades, it leads to a massive loss. The profit factor (total winners divided by total losers) is sitting at 0.88, which is really bad (ideally I target a profit factor above 2).
And it took only 9.0 seconds for the Python code to get our statistics. Maybe 5 minutes to write the whole code.
Draw conclusions
So…is it a good strategy to buy at the close of a candlestick that makes a wick below a 4H low?
Based on our sample (over 1,000 trades), it’s a BIG no.
I coded this example for the following reasons:
People often have some bias. They see a pattern playing out one or two times but don’t realize how difficult it is to find a consistent trading system. Imagine going back over the last trading days and seeing something that looks good, and trading it the next week. If you don’t test over 100s of trades, you put your capital at risk.
I wanted an example that shows how a small difference in the average winners against losers plays a major role in the overall results.
What to do from that point?
There are a lot of parameters to play with to try to improve your system:
Look at the time of the trades (maybe avoid specific timeslots);
Add criteria like volume, size of the wick, and current trend…;
There are also a few things that one should pay attention to:
Be careful of not doing overfitting: changing your variables’ parameters until you see a winning equity curve. What you can do to avoid that is to test your strategy on a sample of your whole dataset, do your parameters optimization, and then run your code on the rest of the sample.
Take into account slippage, and commissions… but this is not in the scope of this article.
There are a lot of resources where to learn how to program (Google is your friend).
Programming is not that hard
I believe that one has to evolve with its time, and programming is an incredible tool to have by your side. Don’t forget that you’re competing against someone else when you trade. Most likely, someone that is smarter than you. Do you want to spend your trading career without using the most advanced technologies? You have the opportunity to learn for free online how to program. Many platforms offer tools to test your strategies without doing the actual coding. Some companies offer solutions with already programmed systems/tools.
I’m not affiliated in any way with the OFL team (Order Flow Labs), but you got to give them credit. What they are building is fantastic and helps tons of traders. If you’re not following them, I highly suggest you do so.
Below is their last apparition on Youtube, talking about Order Flow. They built tools that allow you to automate so much of the groundwork you would typically have to do. And that’s what programming is supposed to do for your trading career: make you gain time, test hypotheses/assumptions, and be sharper in your executions. You can check out their great work here. Plus, they’re all super cool. Again, this is not sponsored, I just know when I see great work.

I think you understood my point. Start using the latest available technologies. Don’t be that guy who one day wakes up, completely overwhelmed by the world he lives in, incapable of adapting. In trading more than anywhere else, Darwin's theory is king.

Start. Today.
Conclusion
If you’ve made it thus far, congratulations, and thank you for taking the time to read my guide. I do this for free, as a way to give back to the community. I believe in positive karma. If you enjoyed it, please subscribe to my substack to receive more articles like this, and please share this article on your Twitter account. If you’re interested in having the Python code, you can subscribe and I’ll send it to you.
Thanks for reading Retail Capital! Subscribe for free to receive new posts and support my work.
If you have any questions, feel free to ask them in the comment section or reach out to me on Twitter @itsonlyomoney12.
I wish y’all a great day.
Love,
Retail ❤️
If you want to give it a try to Apex and try to get funded, you can use my affiliate link here with my 50% coupon code: RETAILCAPITAL.
Hi - Great article. Thanks for sharing. Were going to be sharing your code now that this was a paid for sub?
Hi there, I'm trying to follow along your example of the 4H wick test script but wondering if you can post the full code for us to test? It would be a great learning tool.
Thank you!