

How is CPI Impacting the Market from a Data Perspective
How is CPI Impacting the Market from a Data Perspective
Special Tricky Edition

Dear Traders,
The CPI number will be released this Wednesday at 8:30 am NY time.
In today’s article, we are going through the impact of the CPI on $NQ since January 2022 from a data perspective.
What does it mean? I’ll share some stats to help you understand the market’s behavior before and during the release. Hopefully, you’ll get one or two things from this article.
For example, we will answer the following questions:
What is the volatility during the CPI news release?
What is the average return the day before the CPI is released?
And a few more…
It took me quite some time to get the statistics and write this article, and I would appreciate a share on your Twitter/Discord.
As day traders/scalpers, a part of our job is to be aware of the economic calendar. I believe macro is useless for intraday positions, but it would be foolish not to think the economic releases don’t move the markets. For example, I wouldn’t enter a trade at 8:29 am right before the CPI news release.
Before we start, here’s the definition of CPI.
Definition
CPI stands for Consumer Price Index. It is a measure that tracks changes in the average price level of goods and services consumed by households in an economy over time. The CPI is used to measure inflation and is often used by governments and policymakers to make decisions related to monetary policy, tax policy, and social welfare programs. The index is calculated by taking a basket of goods and services commonly consumed by households and measuring the changes in their prices over time. The CPI is usually reported as a percentage change from a base period.
In other words, CPI is a measure of the inflation.
Let’s look at some charts about CPI.
The below chart summarizes the CPI numbers since 1970.

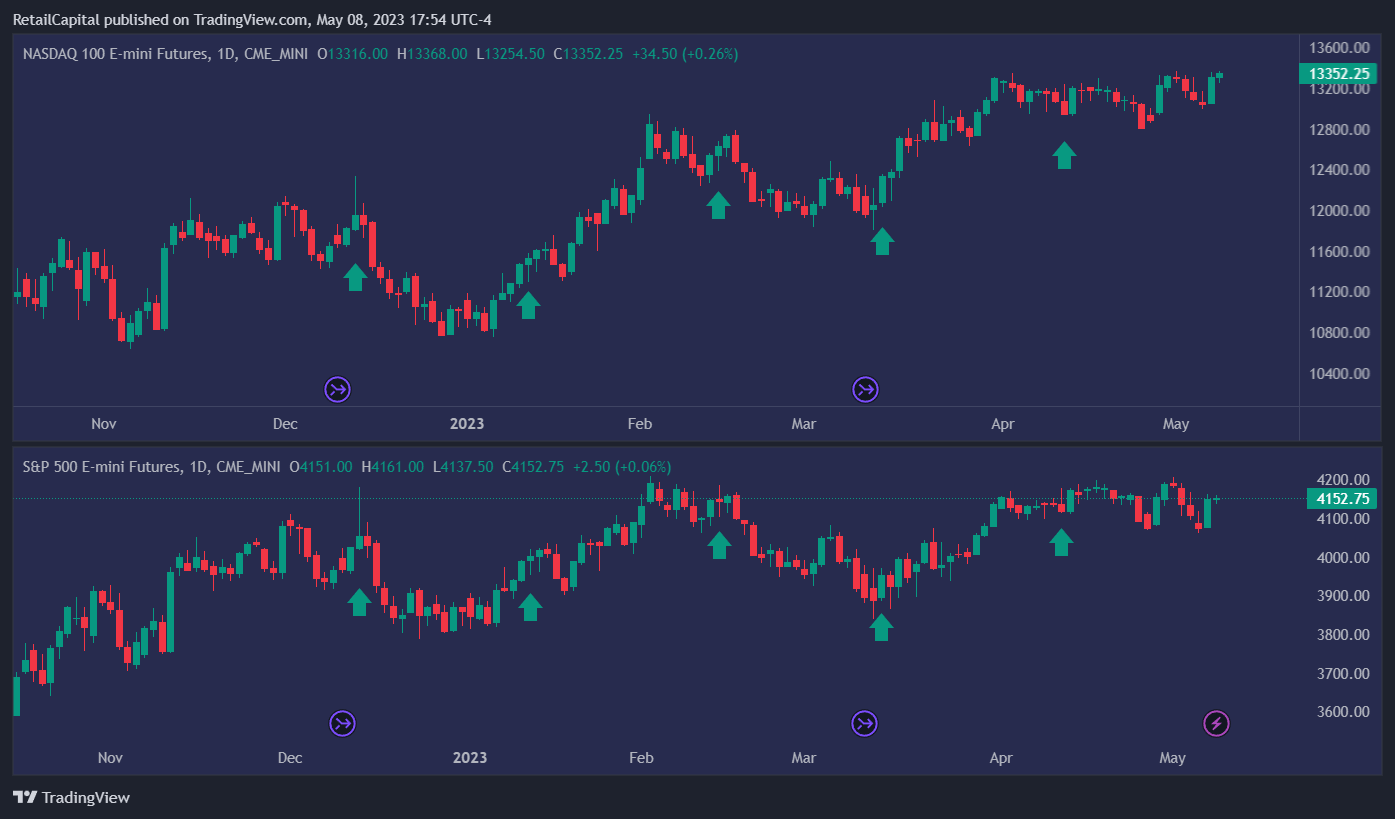
Here’s a daily view of $NQ and $ES with the green arrows showing the days CPI was released since December 2022.
Alright, now let’s jump to the data-crunching part.
This article was inspired by Tricky. Give him a follow on Twitter.
What is the volatility during the CPI news release?
One of the most satisfying things when you have a clean database, it’s that it’s easy to get good and reliable information. I’ll still put the caveat that I’m a one-man team, and hence there might be mistakes in my codes/data, but to the best of my knowledge, it’s accurate. As usual, nothing here is investment advice; I only show numbers. You can interpret them the way you like.

How to read this graph:
On the Y-axis, we can see the historical dates when CPI was released;
On the X-axis, we can see the different period of the day:
OVN stands for overnight (from 6 pm to 9:29 am);
The A period is the first 30 minutes of RTH (9:30 am to 10:00 am);
The B period is the second 30 minutes of RTH (10:00 am to 10:30 am);
… and so on.
CPI is released at 8:30 am NY time so that we can read its impact in the OVN column;
The average range of $NQ during the overnight is 2.9% (much higher than the historical average overnight range).
From February to November 2022, the impact of this news has been greater and greater, peaking in November and started decreasing since. Similar to FOMC impact for those who read my post on FOMC.
I won’t go into too much detail, as I want to keep some stats private, but the periods during CPI days are all significantly more volatile than on regular days.
With a VIX on the decline and the decrease of the impact of CPI on the overnight range over the last few months, I wouldn’t expect a range above 2%.
What is the average return on the day when CPI is released?
Here’s a chart showing the cumulative intraday returns on $NQ on CPI days.

APEX is running an 80% promotion from today until the end of the month.
A few things that stand out:
Except for two days, there is not a lot of action until 8:30 am.
The sharpest moves have usually held during RTH (see blue, brown, and yellow-ish lines) except for the orange line.
The overnight returns seem primarily positive, but we can’t ready properly on this chart, so I’ll share a cleaner one below.
Overall, this looks like a gambling day, as we have a bit of everything.
Let’s look at the numbers!

Since the volatility peaked, the average returns during the OVN period have been relatively high. I’m sure everyone remembers November 10, 2022! One of the craziest days since Covid (at least, for me).
The average return during CPI days since January 2022 is -0.1%. Insignificant. A lot of noise for nothing. So if you blow your accounts during the news, think twice. The average daily returns during CPI news since January 2022 is 0%!
Since November, every CPI except last April had a positive return on $NQ.
What is the average return on the day before CPI is released?
The market often hesitates before major economic releases. At least, that’s the feeling I have of it. This is why trade is more complicated the day before (and obviously the day it’s released).
Here are some statistics on the day before CPI was released (that would be today's equivalent since we have CPI on Wednesday).
Here are the intraday cumulative return on $NQ since January 2022, the days BEFORE CPI was released.

It’s a much more interesting graph than the day of release. Do you notice anything interesting?
If you prefer numbers, here’s the equivalent in a table:

The average return on the day before CPI was released is +0.2%. So on average, we see some upside. However, if you look at the numbers since December 2022, it’s pretty green!
Longevity in the market involves protecting your capital. If I can save one of you tomorrow, I’ll be happy.
Be smart.
Reminder: my website on options is available here.
Speak soon. Until then, stay safe.
- Retail