

How I Scalp (a detailed trading guide)
How I Scalp (a detailed trading guide)

Welcome to this new edition of the Retail Capital Newsletter. Subscribe below and join thousands of traders:
Listen to my latest podcast episode on Spotify. Make sure to give me a follow and a 5-star rating, it helps me a lot.
Promotion: Looking to trade futures too? You can get funded for less than $100 with Apex. If you want to try the Apex Funded programs, you can use my affiliate link here with my 50% coupon code: RETAILCAPITAL, which will always apply the best available promotion.
“Never Give Up On Something You Can't Go A Day Without Thinking About.” ~ Winston Churchill
Introduction
Dear Traders,
This piece of work is my way of giving back after everything I learned from other traders over the years. I’m amazed that a thousand people follow me on Twitter and hundreds of people on Substack. Thank you to everyone for being part of my journey and giving me strength when I need it. This adventure is the best thing that has ever happened to me, and I hope my articles provide some guidance for some of you. I will also review the scalping session for the first few persons who asked.
I will, for obvious reasons, not share my scalping strategies. However, my goal is that by the end of this article, you’ll get the following takeaways:
A better understanding of what being a scalper means;
A systematic framework to approach the market;
Tools to read and exploit your P&L;
New ideas to start building measurable trading strategies;
Tools to identify volatile days to avoid losing it all;
Tips to understand how your risk impacts the evolution of your trading capital;
Actionable ideas to incorporate programming into your trading arsenal (don’t be afraid!!)
It’s quite a heavy schedule, so I’d suggest you don’t read it in go. The more we advance in this guide, the more technical it’ll get. Take your time, take notes when something speaks to you, and see how to implement it in your daily trading life. This article took me hours to write and is basically a summary of my last ten years of trading journey, full of mistakes, pain, tears, hope, joy, introspection… I do believe it made me a better person, and I hope people realize the chance they have to be able to go for such a career in today’s world. Trading is my passion. Most days, when I close my eyes, I see candlesticks. During the weekend, I can’t wait for markets to open again. A wise man once said, “Never give up on something you can’t go a day without thinking”.
Note: If you read this in your email app, the article is too long so you’ll have to switch to click on “view entire message” at the end of the email.
Caveat: None of this is financial advice. I write out of passion, and you are responsible for your actions.
A better understanding of what being a scalper means
Become a Samurai and scale-up

Being a scalper means catching small moves, multiple times during the day, with a tight risk. It also means, leaving a TON on the table. Being a scalper is a philosophy. It’s a choice of life. I see it as being a samurai. To survive, you need to execute the perfect gesture, on every single trade. Day after day. Week after week. Month after month. Year after year. You have to practice every day, be a humble student of the market, and master your emotion. Scalping is probably the most frustrating type of trading that exists. If you’re wrong, you’ll take an instant loss. If you’re right, and you hit your take profit of +20-40ticks, you might see prices going 400-800 ticks in your original direction, but you won’t be in that train anymore.
As a scalper, you need to be in absolute control of your body and mind, at any time. You profit from micro edges you have against the market. There’s no place for hard feelings. If you let the frustration take over, you’ll be soon gone.
What is scalping (to me)?
My definition of scalping is pretty easy, get in and get out of your trade in seconds, sometimes a few minutes, but no more. I don’t do scaling, or leave runners. I like to go with my full size and take my win or my loss.
I’ve attached below a screenshot of two of my scalps from last week. Both lasted less than 2 minutes. I use a 10 ticks chart, even if there are many candles, it’s just a time-lapse of a few seconds.
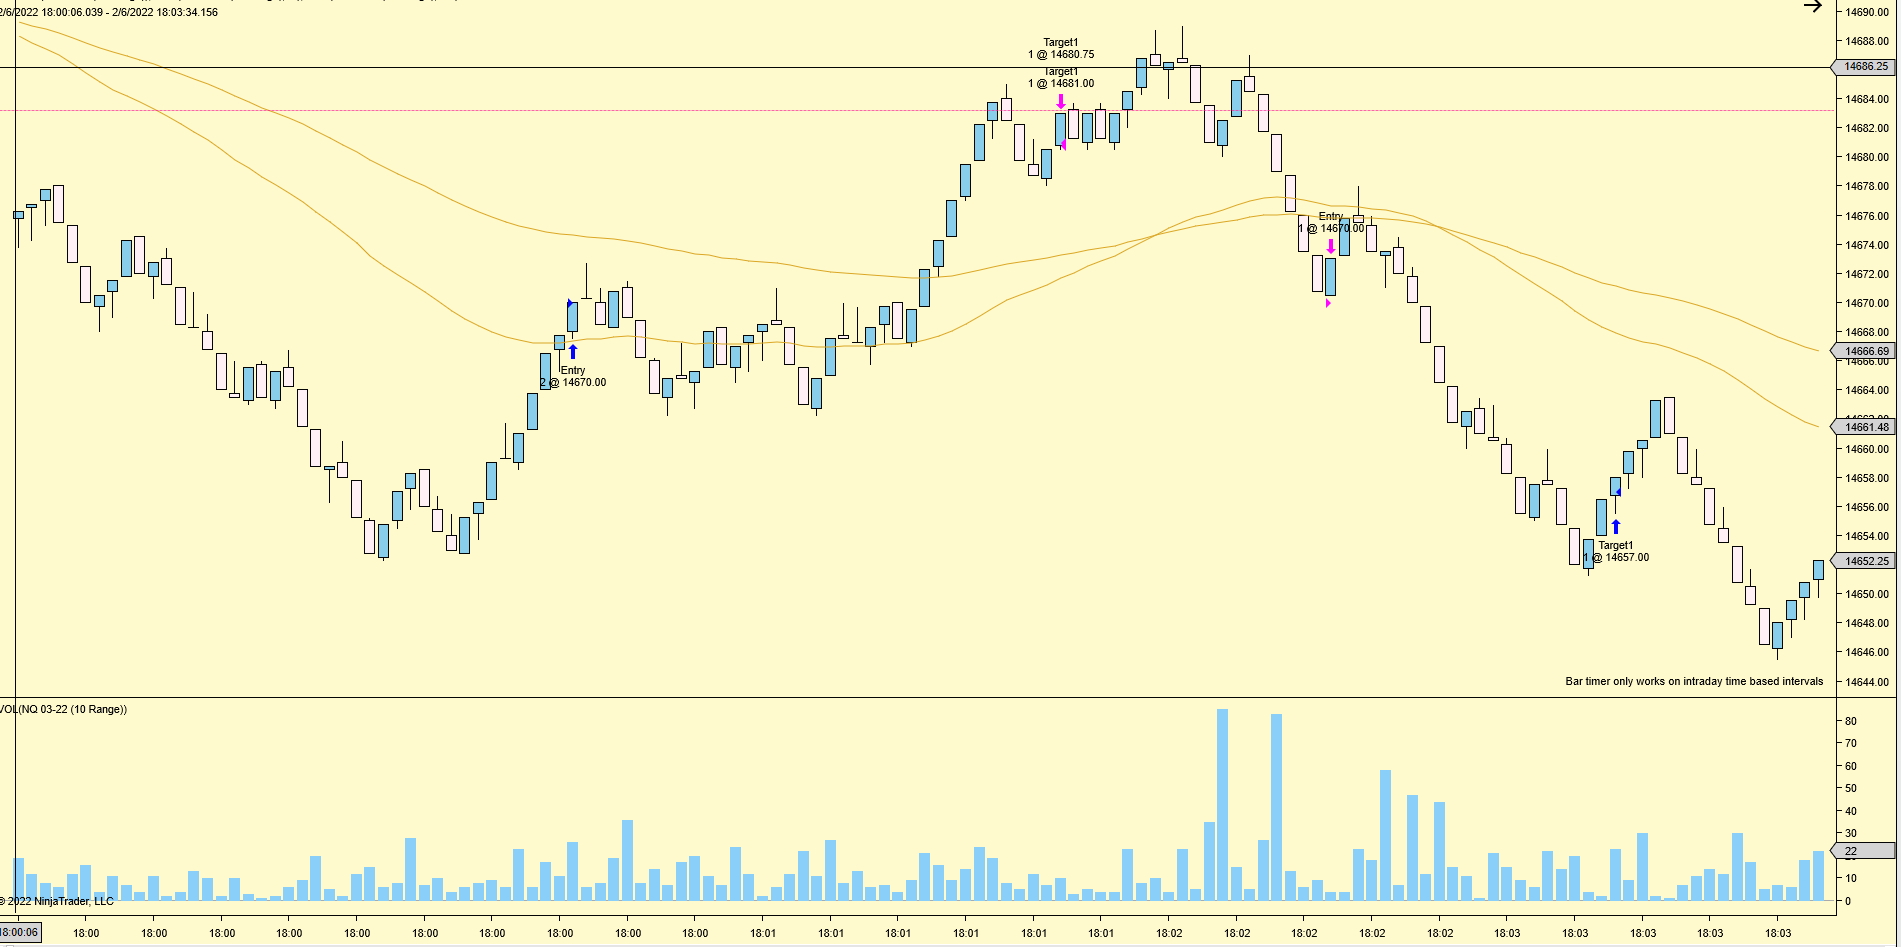
To me, the beauty of scalping is that you get instant feedback from the market. You enter, and a few seconds after, you know if you were right or not.
This is crucial to me because it allows me to refine my strategy over and over whereas if I was a day trader or a swing trader, it would take me so much more time to gather enough trades history to see if what I’m doing is profitable or not.
The only inconvenience with scalping is that most people tend to overtrade. A year ago, I was doing more than 100 trades a day. I was exhausted by the end of the week and it was too many trades to review, so I wasn’t making any progress.
I list below my dos and don’t of scalping.
Dos
Extensively prepare your session, and identify areas that have a high probability of rejections. The worst thing you want is entering a trade and missing the bigger picture, which will lead to your stop loss being hit in seconds.
Have a tight stop loss. You can have a positive risk-reward ratio scalping, and I highly recommend it.
Have a clear setup and trade it over and over.
Review your scalps at least on a weekly basis.
Don’t
Take too many trades. You’ll get lost and won’t even remember what your primary strategy is.
Have tons of indicators. Keep your chart clean, you’ll thank me later.
Go for home runs. Scalping is about compounding.
Have a sub-1 risk-reward ratio. I know we discussed it right above, but it’s essential to your survival.

If you can put your ego on the side, have only a short amount of time to allocate to trading every day, and are a technical person, you might want to give a try to scalping.
A systematic framework to approach the market
Say your goodbyes to laziness
If you want to become successful, and we all have our own definition of successful, there’s no secret path. You’ll not only have to put in the hours, but you’ll also need to have a systematic approach to the market. An approach that you can repeat, day after day. An approach that you can measure, day after day. This is critical because you want to gather as many data points as possible to see where are your strengths and weaknesses.
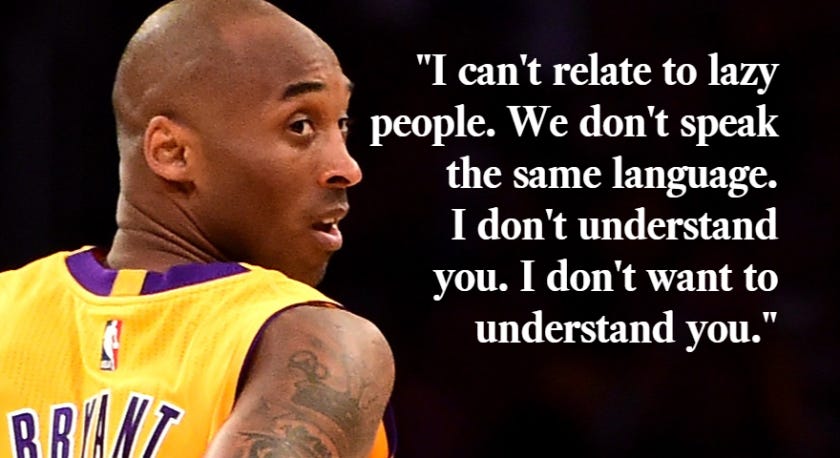
In trading, like in any competitive field, you’ll need to elevate yourself to new highs every single day. There’s no place for laziness, contemplation, or ego (yes I talk about ego a lot because you need to get rid of it). I’m not a basketball fan at all, but this guy is an aspiration. Working harder than anyone else, even when he was at the top. Working hard as he’s only comparing himself to himself. There’s no limit. Same in trading. A year from now, you could be losing a trader or a winning trader. If you want to give yourself a chance, you’ll have to work your ass as you’ve never done before. Sacrifice anything without excepting anything in return. You have to love the game, not the money.
What does a systematic approach to trading looks like?
It will be different for everyone, but I believe there are some constants.
Market preparation
It all starts the day before. You want to be ready before the next trading session starts.
Below is what I use during my trading session.
I trade with two charts: 10 ticks and 40 ticks range charts.
I use Volume Profile, deltas per price, volume, VWAP, and VWAP bands.
That’s all.
However, during my preparation time, I use other timeframes. I always start with higher timeframes, especially during times when we enter new prices territories (or unseen for a long time). If we’re evolving in a range for a few days/weeks/months, it’s easier because we already know the key levels, and to me, less preparation is required.
However, when we keep making new highs or new lows on the daily and higher timeframes, it’s critical to spend more time analyzing the previous days where prices were evolving at these levels.
I like to look at the following:
Quarterly/yearly closes;
Daily/weekly/monthly/quarterly/yearly highs and lows;
Weekly/Monthly/Quarterly/Yearly VWAP last level;
Weekly/Monthly/Quarterly/Yearly Point Of Control (POC), Low Volume Nodes (LVN), and High Volume Nodes (HVN);
Previous day’s open/high/low/close/30min opening range/VWAP close/POC/LVN/HVN.

This might take some time to have set up on your charts, but it’s worth it. I’d much rather have these key levels than any other indicators. Analyzing the market’s reaction when prices hit these levels will give you key insights into where the market wants to go.
You might not see it directly, and that’s why you need practice time. Eventually, it’ll become second nature during your trading session to analyze quickly and take action accordingly.
Practice until it’s perfect.
Morning ritual
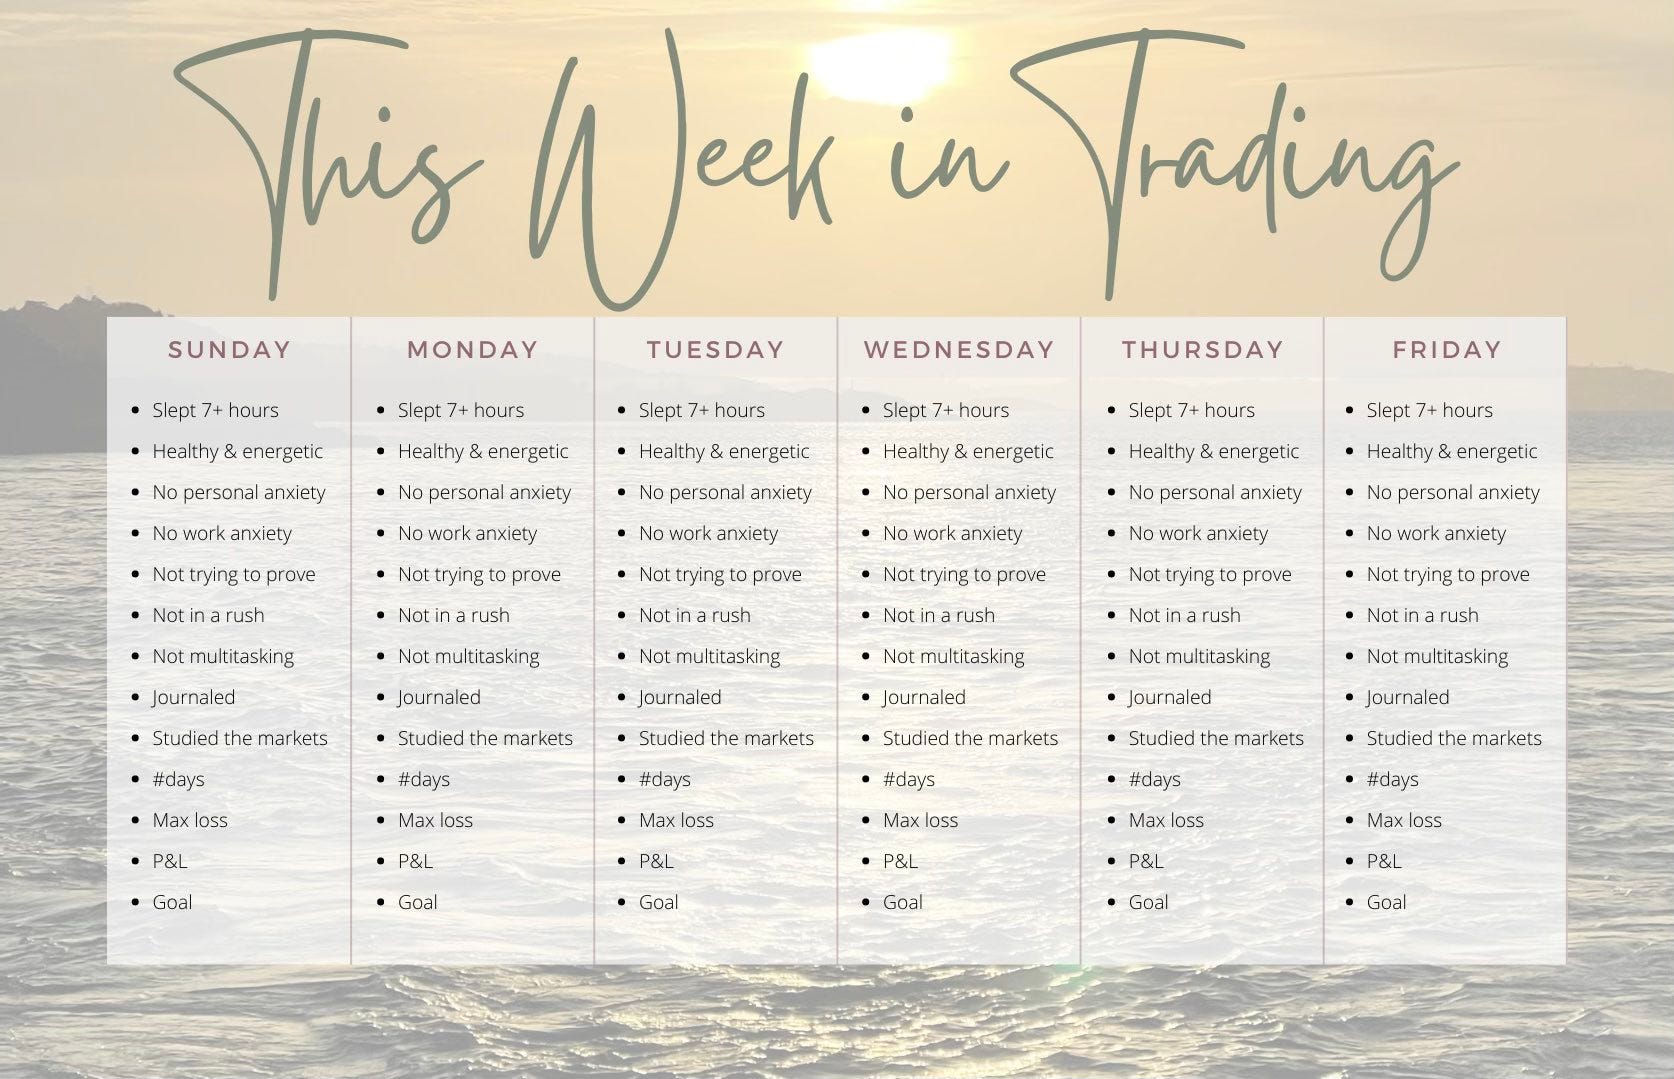
I’ve already shared that on Twitter, but I have a very strict ritual regarding my morning routine. I like to tick as many boxes as I can on the checklist that I’ve attached above. If there are more than two boxes unticked, I simply don’t trade. There are also specific market conditions where I don’t trade, as I know I don’t have an edge:
If the market hit an all-time high the day before and we closed in the top 25% of the range;
If the market was up more than 2% the day before.
I’ve proved to myself to be consistently losing in the above conditions. Until I don’t have a clear and defined edge, I’ll never trade the days following the above events. It will be different for you, but it’s good to be aware of this and take action (in that case, the action is to not do anything).
There’s enough money to be made during days where you have a defined edge, so don’t feel bad about it, and don’t let your ego goes in your way toward success.
Then, I take my coffee, open the charts, and look at the overnight action. If any significant action, I can reassess the key levels I drew the night before.
Now, it’s time to trade.
Trading time

If you’re an aspiring trader, chances are that you’re still stuck in a 9-5. If that’s the case, your screen time is very limited. I think the biggest mistake beginners do is to trade from their phones.
I’ve been guilty of that for years. What a waste of time… and money! Do you seriously think you can outsmart hedge fund algorithms, experienced retail traders, by trading on your phone when your boss gives you a few minutes of freedom throughout the day? I’ll save you some time, it’s not gonna work.
You need to find a window in your day that is dedicated to trading and only trading. It can be as little as 45min a day. If it means you need to wake up at 4 am, then do it. Everything has a cost.
The benefits are multiple. I’ve listed mine below:
I’m in a deep focus mode trading from 6 am to 7 am every single morning';
I’m really excited to wake up because I know the first hour of the day is investing in my future life;
I am more comfortable with the market I trade because it moves in a specific way during pre-market;
I can’t overtrade. Once the session is done, I move on and go to my work.
The latter point is maybe the most crucial reason for my recent ‘success’.
Journaling
Hands down my favorite time of the day. It’s peaceful, the job has been done, win or loss. Now is the time to look back at the choices you made during the day, and see how well you executed the plan you had, and the strategy you built.
Here are some of the questions I ask myself, and what I note in my notebook:
Have I only traded setups that I know are A+ setups (e.g., proven profitably from my backtests)?
Have I been emotional at any point during the day?
Have I waited at least five minutes after a losing trade (the time I need to cool down and don’t make big mistakes)?
Have I felt in line with the market today?
At the beginning of my journey, I had more questions on my list, like:
Have I respected my max loss?
Have I not traded during the market opening?
Have I not let anyone’s else view skew my trading?
They are now gone from my list as it has become second nature, but you might want to have these in yours if you’re starting. You are the one who knows your strengths and weaknesses, so build a list of questions to rate your own trading, day after day.
By trading only one hour a day with one system, you should not have too many trades taken. This will immensely help you in that reviewing process.
Analyze each trade, and look at the parameters that made you enter and exit that trade. See how you executed the trade against the plan, and draw your conclusions. Then, when the next day comes, you know exactly what you need to improve.
Maybe you closed too early, maybe you entered a bit too late because you were scared.
Repeat that process every day for a month, and I’ll promise you that you’ll see the difference.
(Bonus) Talking to someone
The best thing is to have someone to talk to about your trading. Let’s face it, it’s quite difficult to have close people to talk to about trading. This is a pretty uncommon career path, and most people see it as gambling. I’m lucky I have my partner who is absolutely amazing and listens to me every single day about how my trading day went. With Twitter, I’m sure you’ll be able to find someone to talk to. My DMs are also always open if you need someone to talk to (However, I’ll answer when I want. I choose to trade to be free, not to have obligations). But yeah, don’t be scared. Ask people for help, you’ll be surprised by all the positive answers you’ll get, and the connections you’ll build.
Tools to read and exploit your P&L
If you don’t know what MAE, MFE, PF… mean, then you’re at the right place.
At the end of this section, you’ll be able to analyze your own P&L and improve your trading results.
Trading is like running a company
All companies have a Balance Sheet and a Profit & Loss (‘P&L’). When you’re a trader, it’s no different. The cost of doing business as a trader will be your losses, commission, and fees (A). Your gross revenue will be your winning trades (B).
Your net profits will be (B) - (A).
But there’s more than that.
Let’s take a look at my Year-To-Date P&L (1 January 2022 to 5 February 2022).
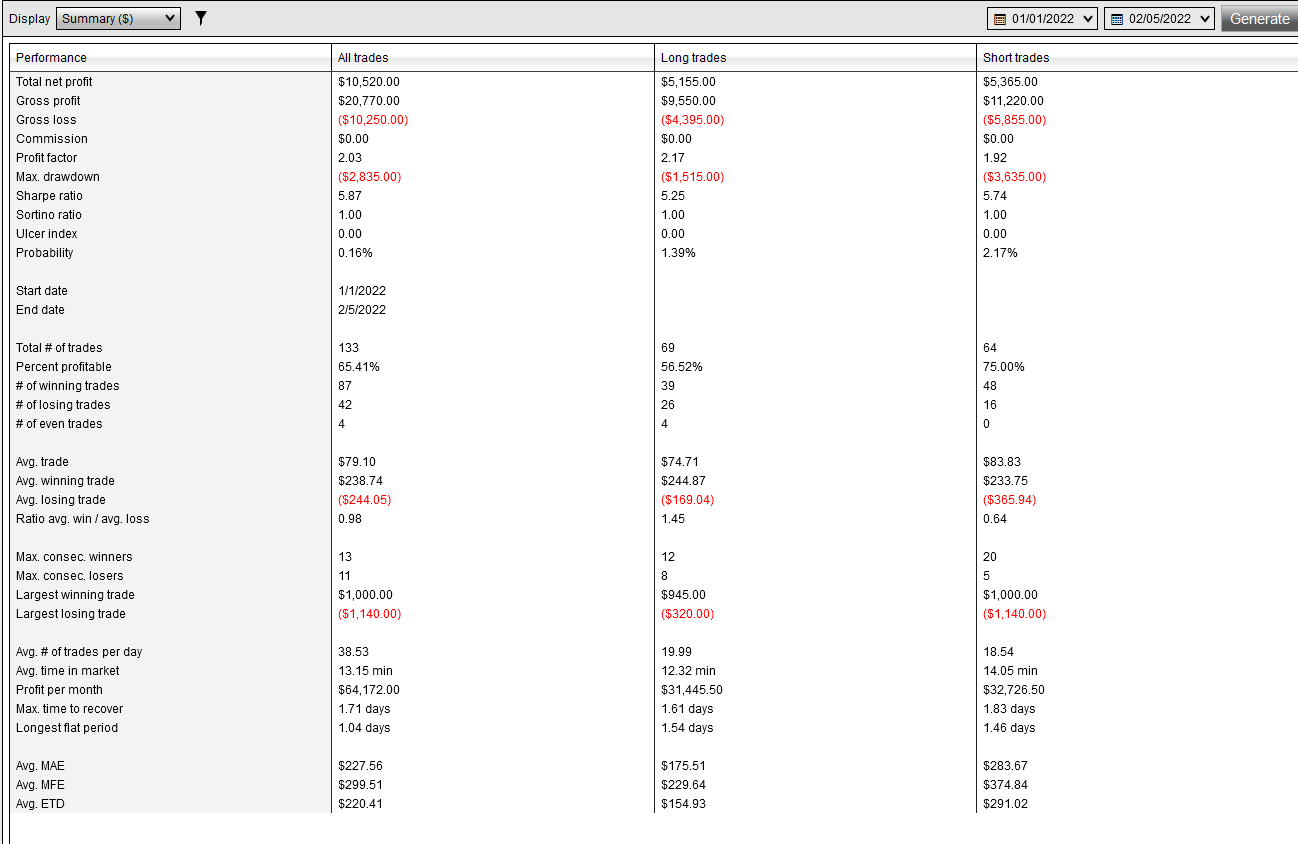
A P&L statement can be intimidating at first, but I will explain each line of it so you can do it too.
Let’s start by adding some colors and defining the 6 most important areas in your P&L.
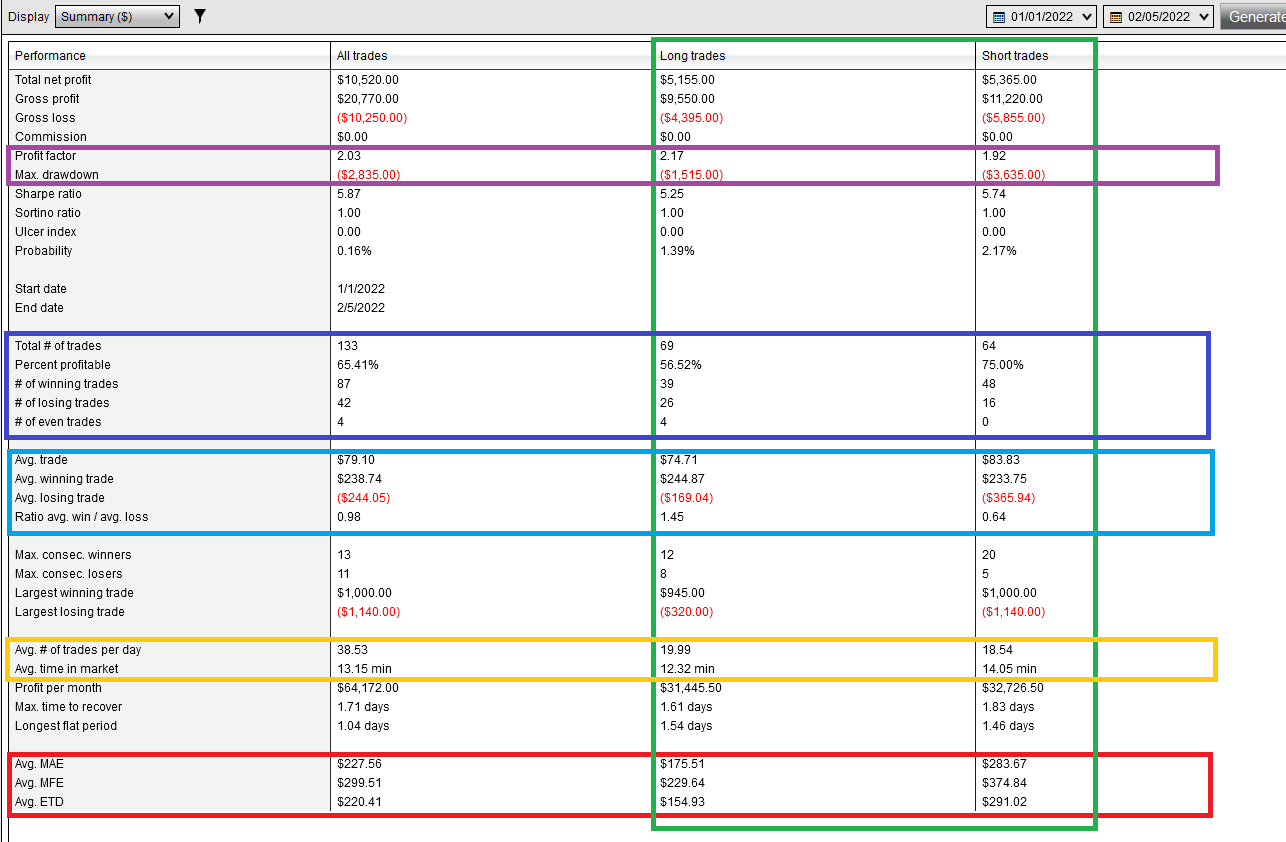
Where do you make and lose your money?
Last year, I lost $15,000 trading. During the first 5 weeks of 2022, I made $10,000. All of this is because I’ve spent hours analyzing my 2021 P&L and taking action to improve my biggest weaknesses.
1. Short vs. Long - Green rectangle
The first statistic I look at is my net profit between Long and Short trades. I try to remain as balanced as I can. As a scalper, you should be able to play both sides to make consistent profits, day after day.
Last year, for example, I lost around $40k in my short trades and made around $25k with my long trades. My key focus for 2022 was to stop bleeding on my short setups.
I’ve analyzed every one of my 500+ short trades to see what was wrong and have fixed most issues.
If I would have paid more attention, weeks after weeks, to my P&L, I would not have ended the year in the red.
2. Profit Factor and Max Drawdown - Purple rectangle
Profit Factor is a trading performance indicator defined as the ratio of gross profits to gross losses.
If you’re a profitable trader, your Profit Factor will be greater than 1.
If you’re a losing trader, your Profit Factor will be less than 1.
Simple, right?
The greater it is, the better. If you have a Profit Factor of 3, it means that for every 1$ you lose, you make 3$, indicating a very robust trading system.
3. Number of trades and % profitability - Blue rectangle
I use this to monitor the quality of trading. I try to avoid overtrading, as I know it cost me in the past.
My ideal number of trades is around 100 per month. It’s easy to review and draw conclusions from.
The percent profitable, or success rate, is simply the number of winning trades you had, divided by the total number of trades you made.
I target profitability above 60%, ideally 65-70%. But this alone will not make you profitable, it goes with the average trade result.
4. Average trade - Skyblue rectangle
This metric tells you how much you lose on average in your winning trades and losing trades. This is very powerful information and will tell you a lot about your psychology and your methods.
Do you cut your winner too quick and let your loser run? You’ll see it here!
If you use brackets (fixed stop loss and take profits), then you should not be surprised by any of the numbers here.
5. Time in the market - Yellow rectangle
We know that the markets tend to go down quicker than they go up.
My interpretation of this is that my short trades should be shorter than my long trades. If I’m short, I want to be right quickly.
Otherwise, I cut my position for a small loss.
6. MAE, MFE, and other sorcery - Red rectangle
Maximum Adverse Excursion (MAE)
This is by how much your trade goes against you, on average. I like to compare that number to my average winning trade.
Whatever is your trading style, you always want to have the smaller unrealized loss possible.
I learned last year that I was entering way too early in most of my trades. Now, I’m much more patient, because I know that over thousands of trades I lost way too much money.
Maximum Favorable Excursion (MFE)
This is the maximum profit you are making on each trade, on average. You want that number to be as close as possible to your average winning trade.
If it’s not, it means that you’re leaving too much on the table, on a regular basis.
New ideas to start building measurable trading strategies
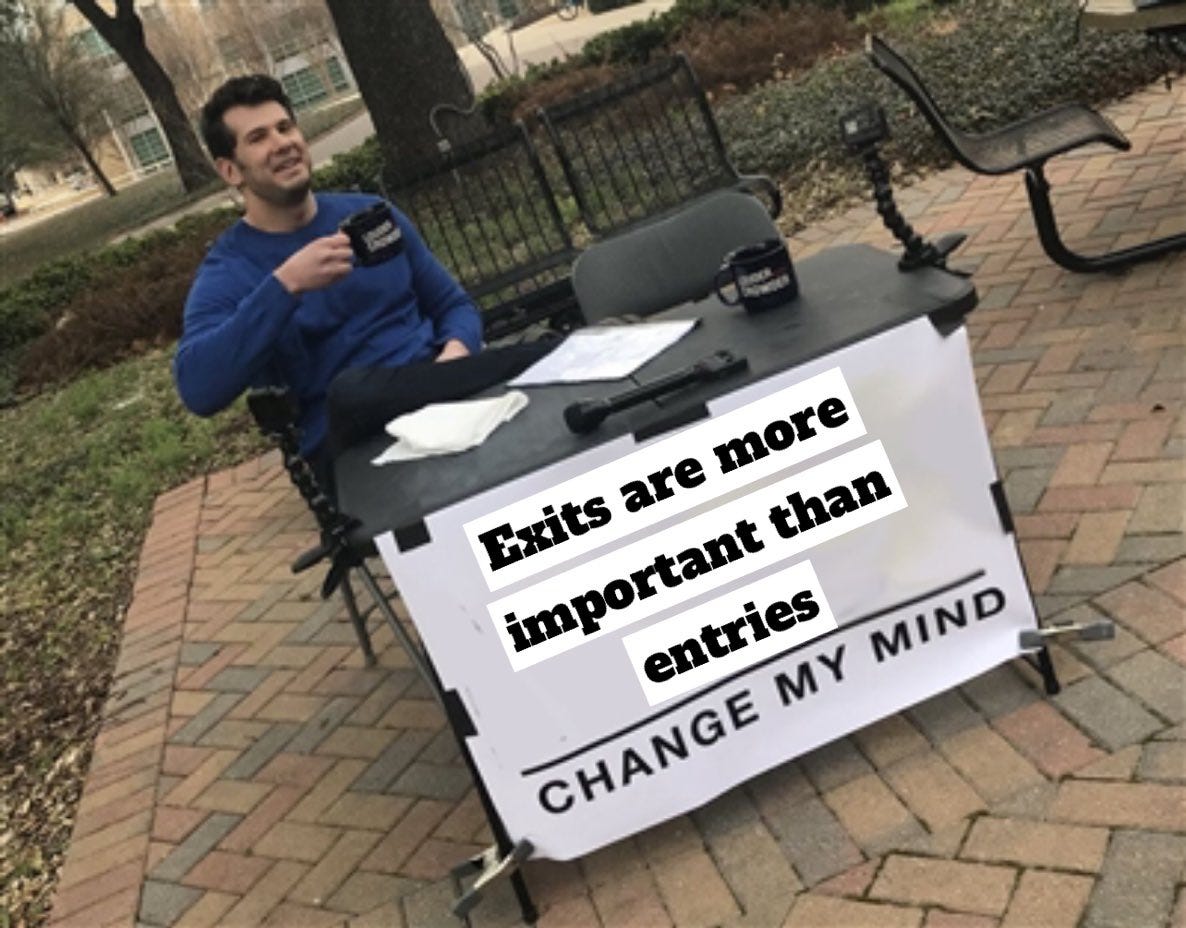
I’m a firm believer that your exit is more important than your entry. I know a few traders that challenge themselves by doing trading sessions with an algorithm that takes random entries, and then it’s up to the trader to close the trader. These are exceptional scalpers, but I guarantee you that end up their scalping session in the green much more often than in the red, with random entries.
This section will be broken down into two parts:
How to create a simple framework;
How to derive a simple strategy from the framework.
We will focus on building a framework around VWAP (Volume Weighted Average Price) for the following reasons:
It’s widely used across the trading industry;
It’s a consistent approach to trading. Every day, VWAP will be here. You want something consistent to be able to measure your success and failures, in order to learn from them.
I apply that framework every single weekend during my review sessions.
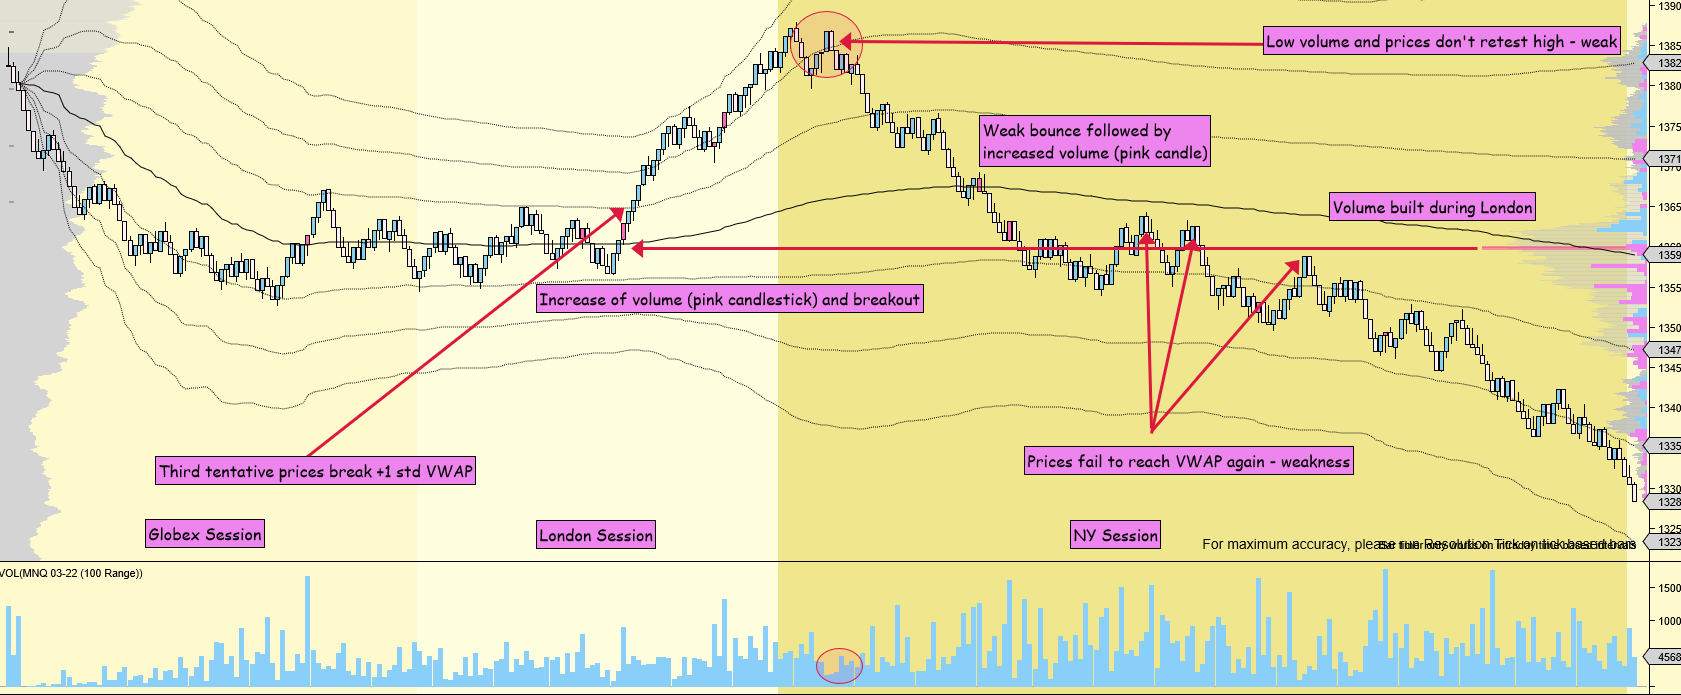
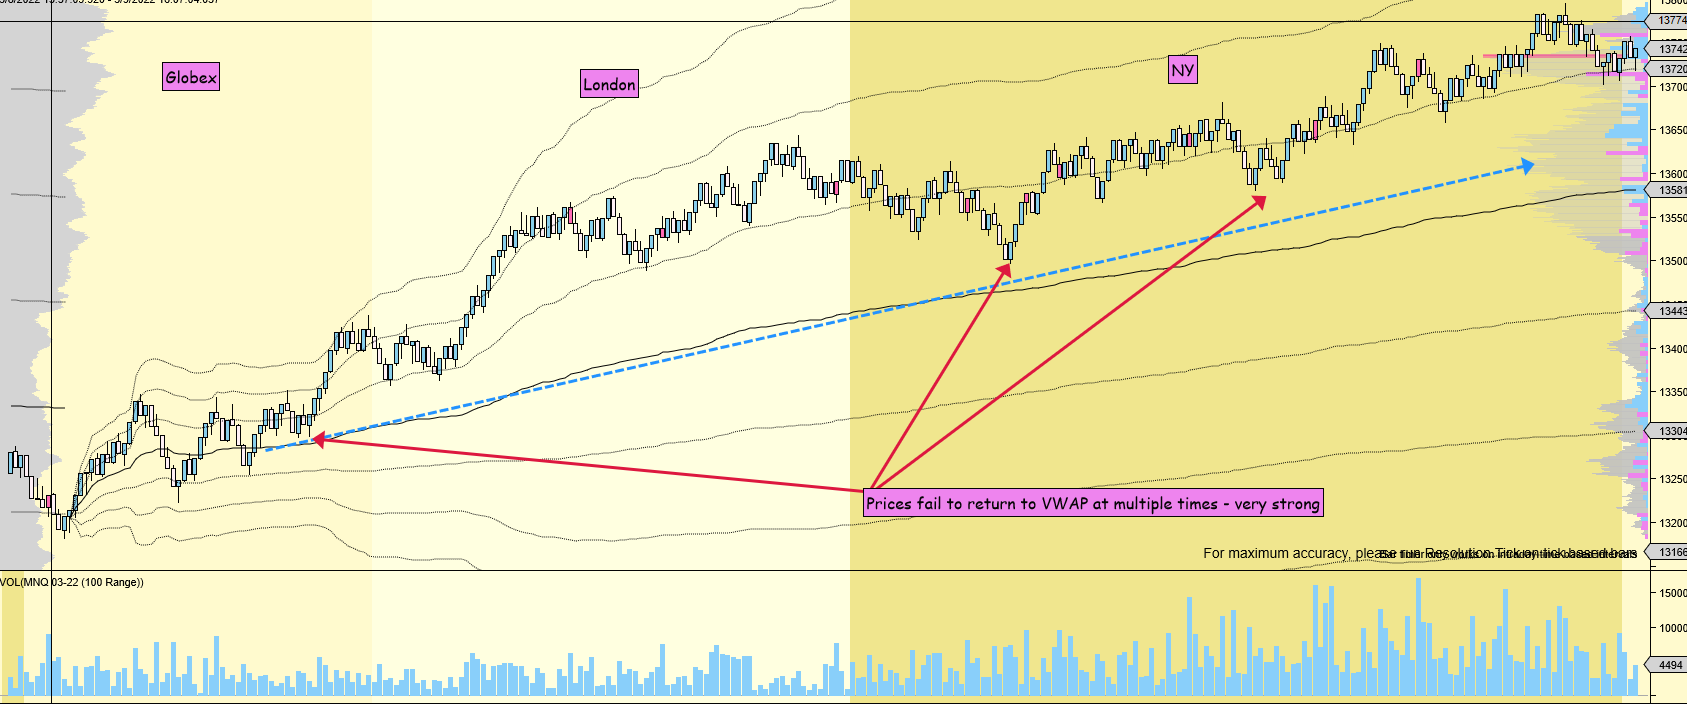
Sunday/Monday
Drop at the open followed by a rally during London's session. NY opened at the high of the day and prices saw a continuous nuke all day. VWAP was never strong support and prices failed to reach it again after it broke. Prices ended well below VWAP at end of the day.
Tuesday
Consolidation around VWAP before an impressive run through new highs of the day. Reactions at VWAP were very interesting and left clues for the rest of the day. Prices end the day at around VWAP and POC.
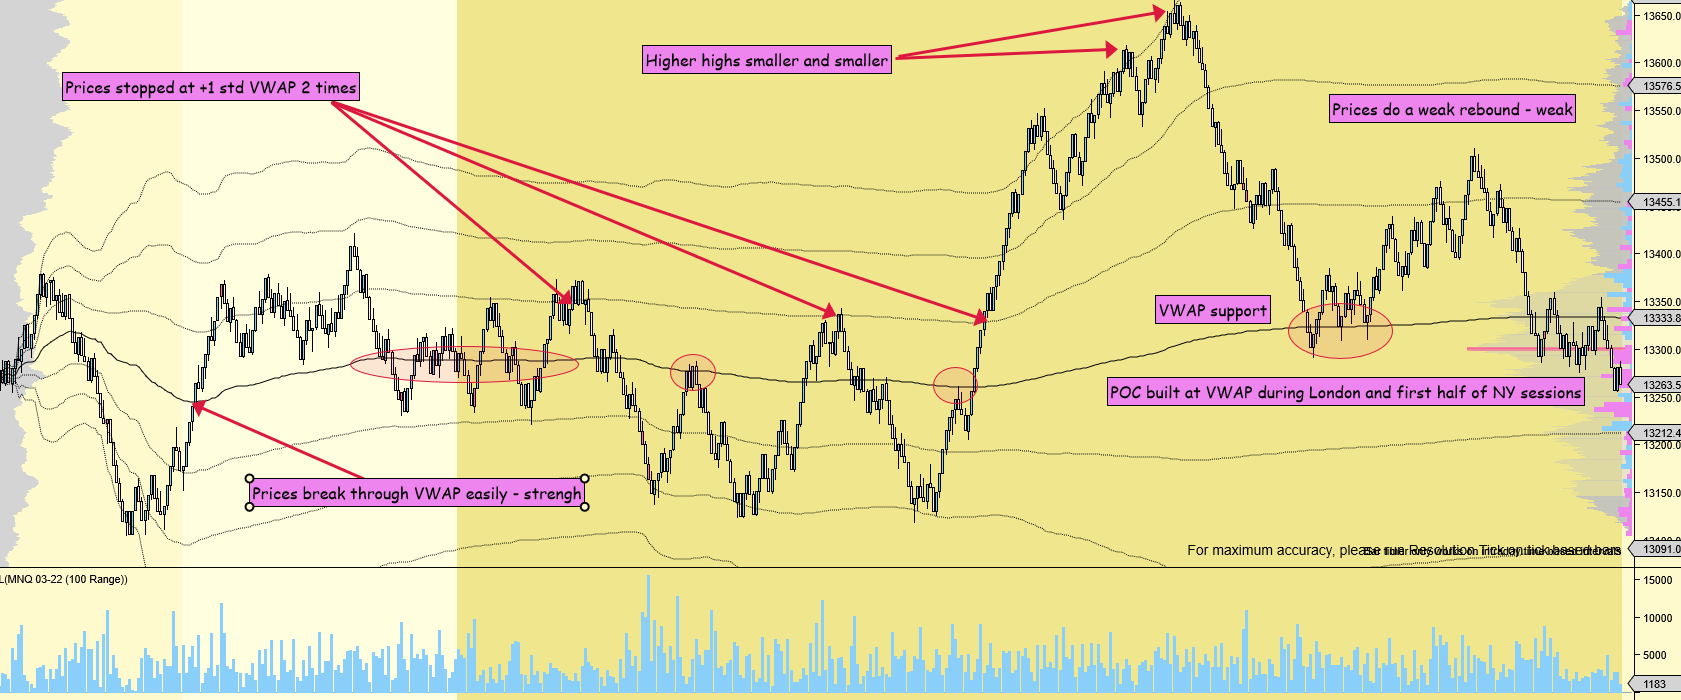
Wednesday
The most interesting day. Tuesday showed strength through VWAP's reaction. Wednesday was a straight day up through all 3 sessions. A day to study!!
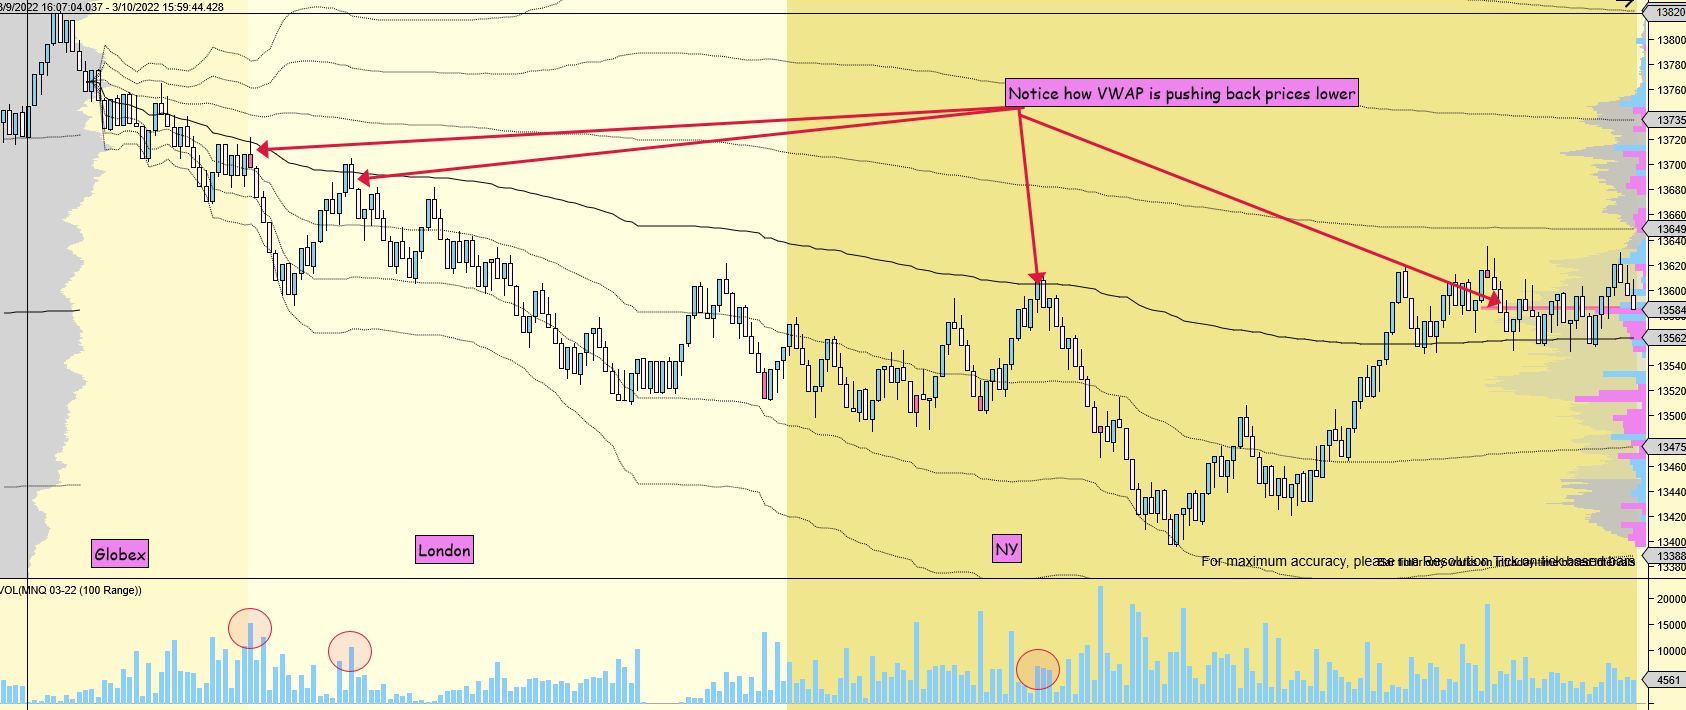
Thursday
After the green dildo from the day before - look at Thursday's action. VWAP has defended every bounce with bears being in total control most of the day until the 4th assault at the end of the day. Prices closed at around VWAP. Very clean PA and lots of points to be made.
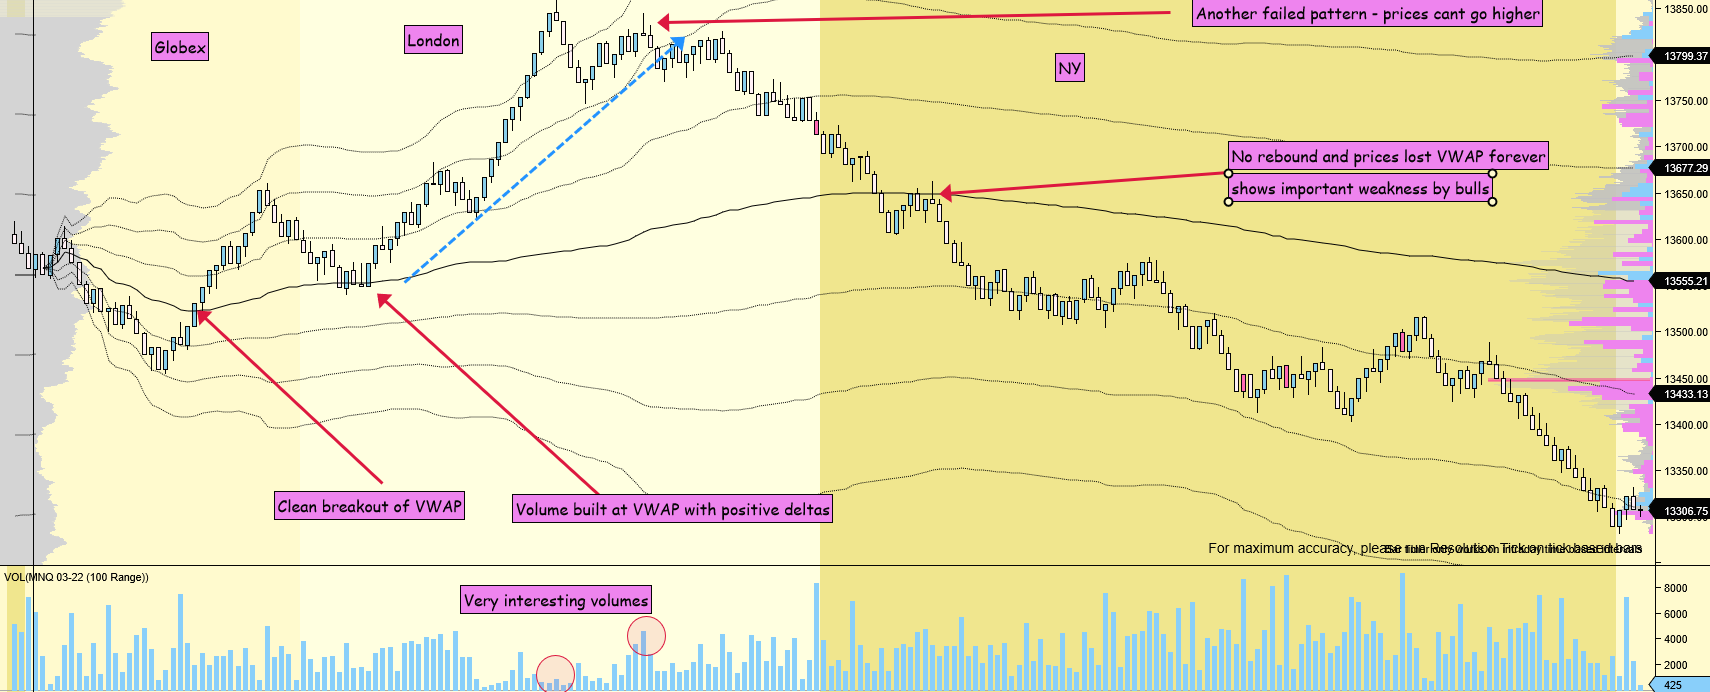
Friday
Second most interesting day. Clean breakout of VWAP then successful retest, maybe the cleanest setup of the week. At NY open VWAP was quickly lost + failed double top of London session indicating bear trend day.
You can make a career out of VWAP only. Study this week's PA and the reactions through VWAP. Pull the triggers when it's a clean setup. One trade a day can be enough.
Tools to identify volatile days to avoid losing it all
Lately, the action has been “crazy” in the markets. People like to identify days where they don’t have an edge to crazy days. Usually, it’s massive trend days, up or down, doesn't matter. Every time the market close +/-2%, +/-3%, many people lose it all.
There are a few ways to know in advance if tomorrow will be a “crazy” day, namely:
Did we have an inside day the prior day?
What does the VIX look like?
How about the fear/greed index?
Building statistics sheets.
I’m gonna talk more about the latest point, and how to build statistics sheets, and I advise you to build similar statistics for every single scenario that might lead to “crazy” days.
Building statistics spreadsheets
Distribution of daily returns since March 1995
The daily returns almost follow a normal distribution
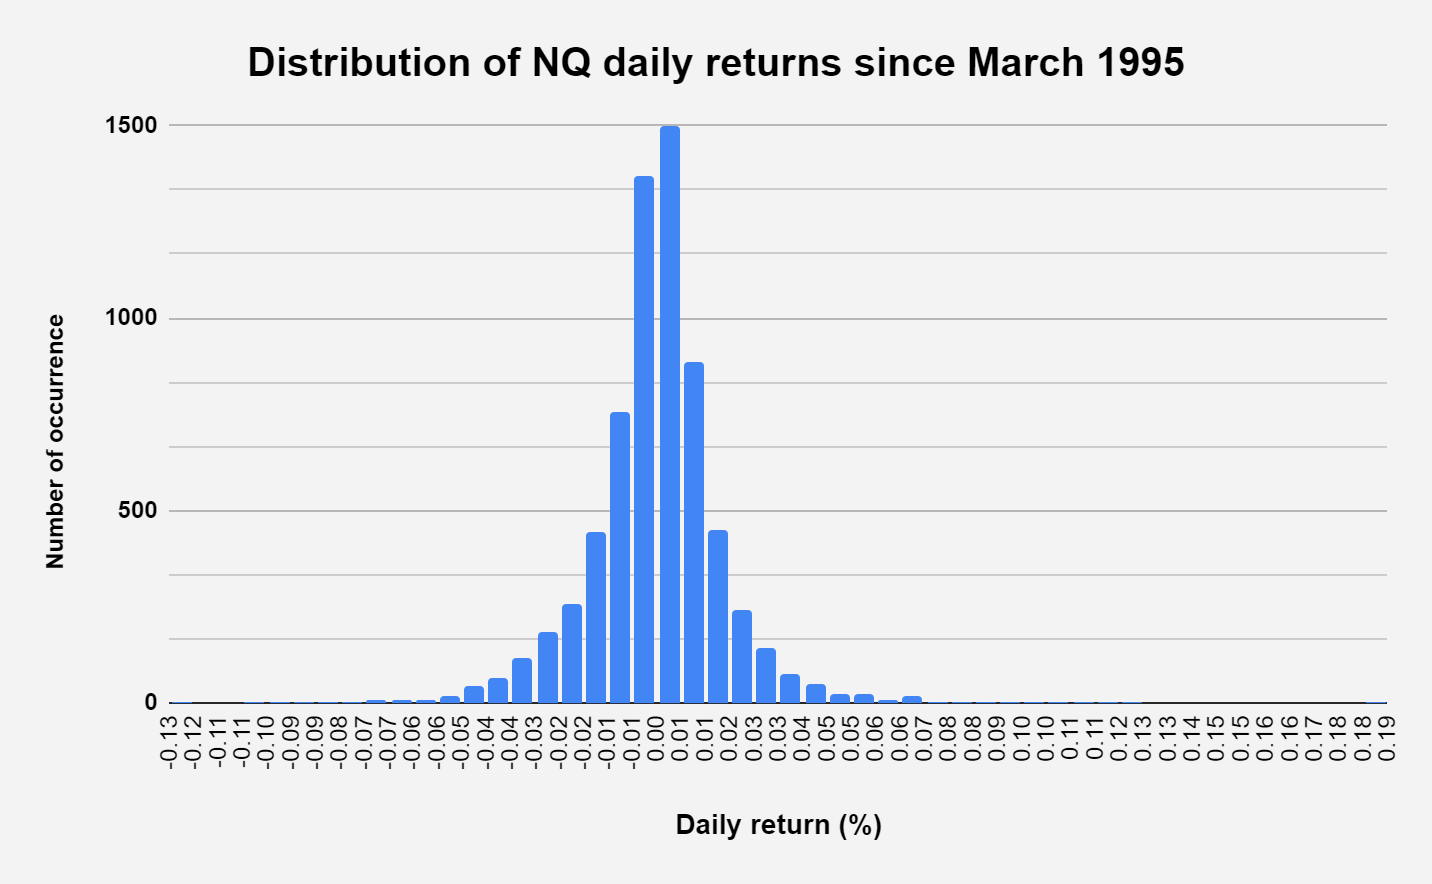
First, let’s try to measure what is considered an abnormal red day.
The above chart is a histogram representing the distribution of Nasdaq’s daily returns since March 1995. As one can see, this looks like a normal distribution.
If you’re not familiar, a normal distribution is a mathematical type of continuous probability distribution. I would suggest you read more on Wikipedia, this will be useful, especially if you use the Volume Profile, to understand the concept of the Value Area.
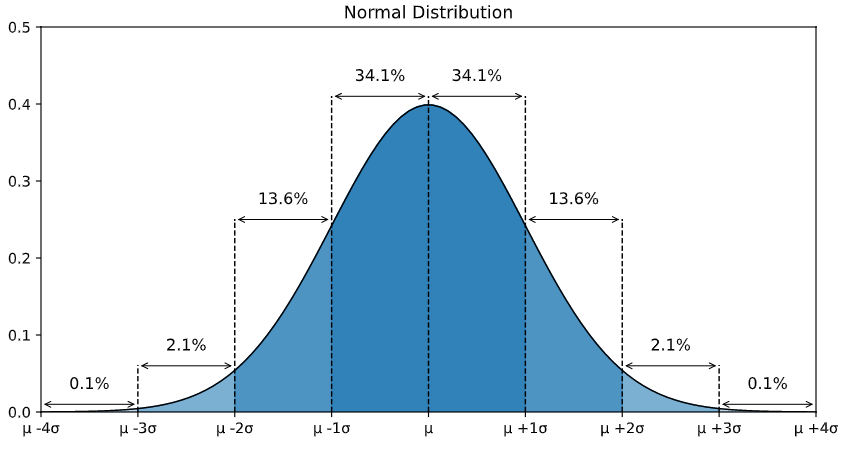
FYI - this is what a normal distribution looks like.
What is considered a big red day?
Hello my friend Percentile
I have ranked every trading day on the Nasdaq since March 1995 and I’ve looked at the return of the 5% worst days. In other words, out of 100 trading days, what are the returns for the 5 worst days in that sample.
For those of you who are interested, this is called the 0.05 percentile.
It’s a very powerful function that allows you to quickly get a grasp of key thresholds in a series of numbers.
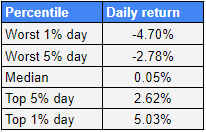
Since 1995, a day that has a return below -2.78% (let’s round it to -3%) is considered in the 5% of the worst day.
My first reaction looking at this is that -3% red days happen more often than what I would expect. 5 days out of 100 we have a -3% red day, or once a month.
Key points from that table
The returns are skewed towards positive returns: the best days have higher absolute returns than the worst ones, and the median is also positive.
50% of the trading days since 1995 have a return at least equal to or above 0.05%.
2 days a year (on average) we see a -4.70% red day.
2 days a year (on average) we see a +5.03% red day.
I find it useful to have those statistics in my mind, especially during volatile times. It helps me keep the bigger picture and trade more rationally.
What happens after a -3% red day?
Ok so now that we’ve paved the foundations, let’s look at the market’s reaction after such days.
I’ve been looking at the returns of the day following trading days that close at least 2.78% in the red. And the results are quite interesting.
Key statistics
357 days out of 6735 we closed below -2.78% (or 5% of the time, ok no big news here that was expected, but it’s always good to double-check our results).
0.50%. This is the average daily return of the Nasdaq since March 1995 on a day following a -2.78% close or worst.
Since 2010, we don’t have as many -3% days as we used to have between 1998 and 2009. The market has changed, and that’s your job to do your homework to adapt and survive. It means that 10 years from now the market will probably be different from today. I personally like to update my personal statistics at least once a year.
Now, does that means that one can just buy the dip at the close of a red day and come back the next day?
Let’s look at this in more detail.
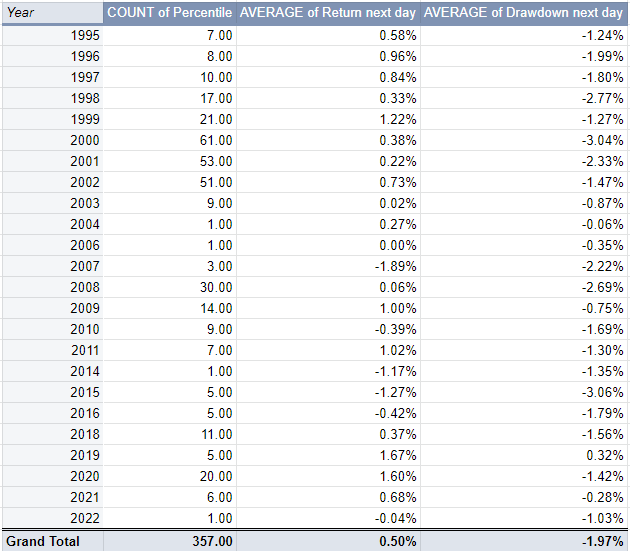
I’ve gathered for you the details per year of each of these following days. Even though the average return is 0.5%, there is a bigger potential, on average, for being short.
-1.97% is the average low a day after a -2.78% red day. Sure, it then retraces and closes in the green, but I find it fascinating that the market still goes almost 2% lower FIRST.
This is the type of statistics you want to build to know what to expect before the trading day starts.
Building a risk framework to avoid losing it all
In this section, I’ll provide you with the framework that I’ve been using for the last few months, and that helped me gain consistency in my trading journey.
KISS Concept
As a retail trader, I believe EVERY aspect of our trading should be kept SIMPLE. You may have heard the KISS principle (Keep It Simple, Stupid). We will never be able to process data as efficiently as Hedge Funds are doing, and we have to fight with different weapons.
From my trading strategies to my Risk Framework, I always apply the KISS concept.
Weaknesses and Strengths
To build a successful trading Risk Framework, you need to know your weaknesses and strengths. I believe we have to learn to live with our weaknesses, making them as meaningless as possible, whilst getting the best out of our strengths.
A good exercise I suggest you do is to list your top three strengths and weaknesses. This will be used as the foundation for our Risk Framework.
For me, it looks something like this.
Top 3 Weaknesses
I’m too greedy;
I become too emotional when the volatility peaks; and
I can’t focus for more than 1 hour in a row.
Top 3 Strengths
I trust myself;
I happily admit when I’m wrong and learn from it; and
I’m passionate about trading.
From these points, we can now build our trading rules/Risk Framework, or as I like to call it ‘The Code’. I’m a big fan of the TV Show ‘Dexter’, where the main character has to live a life full of lies. The only way for him not to get caught and end up in jail is to follow The Code, a set of rules instructed by his father.

The Code
From the above six bullet points, I built The Code, which I try to follow every trading day.
Greed - To avoid being too greedy and turning green days into red days, I now have a target for each day. When/if that target is hit, I close NinjaTrader.
Volatility - I underperform in volatile times because my P&L moves too quickly. To tackle that issue, I have stopped trading the market open.
Attention span - I trade 45min per day, every day, at the same time.
Trust - If there is no clear reason to exit a trade, I stay in it.
Low ego - Review my trades on a regular basis.
Passion - Live to trade another day.
These rules are simple, and easy to follow because they make sense to me. I know why I have to apply them.
Finally, as Leo says, don’t let extreme volatile days rethink your whole approach to trading. You just need to be more prepared.

Tips to understand how your risk impacts the evolution of your trading capital
Beginner's Luck or Unlucky MF? or Why you'll fail in trading if you don't use the Law of Large Numbers A simple graphical explanation

'In probability theory, the law of large numbers (LLN) is a theorem that describes the result of performing the same experiment a large number of times.' Let's see what are your chances of going broke with a specific risk per trade and winrate setups.
Example 1 'The crazy gambler' You start with $1000, risk 10% per trade, win 50% of the time and your winners equal your losers. If you do 100 trades with 10 different accounts, 6 will get blown (60%!!) even though this is not a losing strategy.
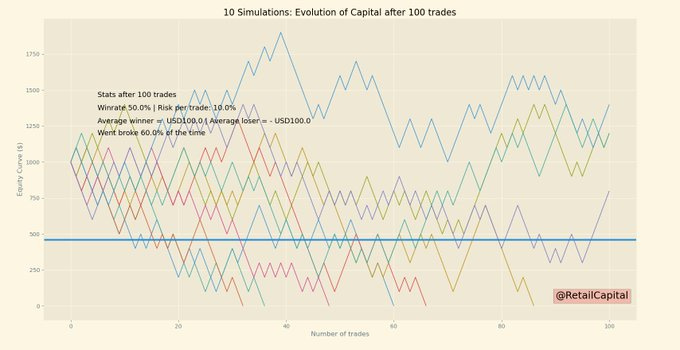
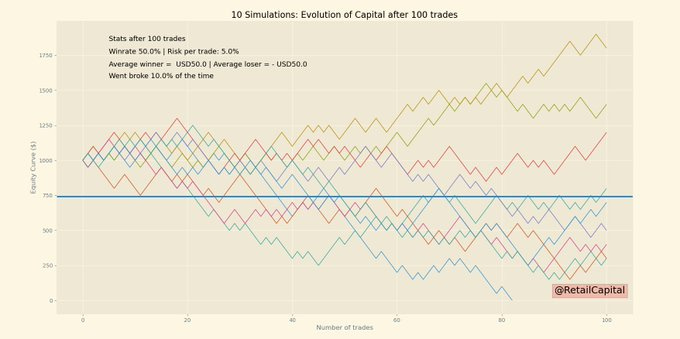
Example 2 'The wise gambler' Same as above but this time we're risking only 5% per trade. Only 1 account is blown this time. By dividing the risk by 2, we are reducing our chances of going broke by 6. Risk is not linear, and it's important to understand it.
Example 3 'The John Doe' Very common - No edge, losers are bigger than winners and you win c. 50% of the time. Your account will die slowly but surely. You don't want to be in this case.

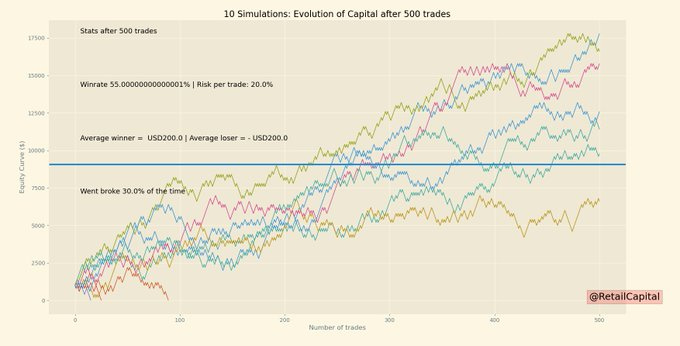
Example 4 'The I have an edge but I gamble' Proven statistical edge but betting 20% of the capital per trade. You'll go broke 3 times out of 10! That's a shame because you could have made a lot of $ respecting better risk management.
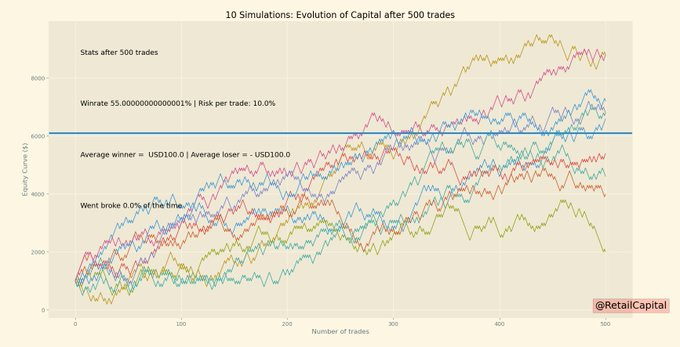
Example 5 'I have an edge and I risk 10% per trade' This time, no account is blown after 500 trades on 10 different accounts. You're in profit every time. See the difference?
Example 6 - 'The Holy Grail' 60% winrate 5% risk per trade Winners = losers After 500 trades, on 10 different accounts, you MADE it. On average, you have multiplied your account by 5.8. Congratulations, you understand why the risk you can take is correlated to your edge.
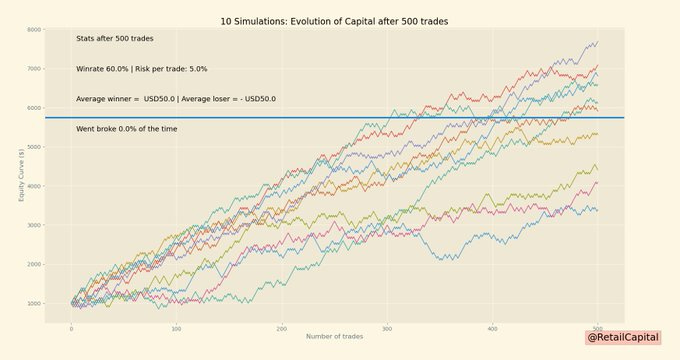
Once again, it’s a lot of groundwork, but you need to understand these mechanics to understand why you can’t risk too much per trade, and how your winrate and risk-reward ratio influence the risk you can take.
Actionable ideas to incorporate programming into your trading arsenal (don’t be afraid!!)
I’ve been programming for years. I started in high school as a hobby learning C/C++, then Java for my first internship, before definitely switching to Python a few years ago. I’m a firm believer that anyone should incorporate some sort of programming into their trading to become a better trader.
Building automated spreadsheet to gather broad statistics (like I explained above);
Building scanners if you trade multiple underlying assets;
Backtesting your trading ideas;
Automating your entries;
Automating your whole strategy.
You can use google sheets and the Yahoo Finance built-in API to start building a spreadsheet that gathers statistics.
If you’re using Ninja Trader, you can start using the Strategy Builder to start backtesting some ideas.
You’ll need to read some documentation, but you will have more insights and statistics for your trading. It can’t hurt. And it’s fun, I promise.
Conclusion
Wherever you are in your life, it’s never too late to live your dreams.
If you’ve made it thus far, congratulations, and thank you for taking the time to read my guide. I do this for free, as a way to give back to the community. I believe in positive karma. If you enjoyed it, please subscribe to my substack to receive more articles like this, and please share this article on your Twitter account.
If you have any questions, feel free to ask them in the comment section.
If you want to give it a try to Apex, you can use my affiliate link here with my 50% coupon code: RETAILCAPITAL.
Incredible article.
Amazing morning read thanks RC. Taking today to create a risk framework/morning routine as well as do/don'ts.