

Backtesting with Python

‘The differences between a quant strategy and a discretionary strategy can be seen in how the strategy is created and in how it is implemented.’ — Rishi K narang
Happy Sunday, friends!
I don’t think it’s the 10th backtesting article, but since I was too lazy to check back, I figured we’d start back from episode X because it looks cool.
Today, we’re going to do a fun exercise with Python and analyze how frequently the price of an asset retest the previous median price of a candlestick over a specific period of time N.
We define the median price as the (High + Low)/2;
The period of time N will be equal to 60 bars; and
The asset we will be analyzing is BTC since that’s what I’ve been trading over the last two months.
I want to credit Paul Smith, who gave me this backtesting idea last week on his Twitter feed, where he conducted a similar analysis on $NQ, and the results were very interesting.
Hopefully, this article will give you some ideas for your trading and drastically reduce FOMO, as you will see by the end that some of the findings are crazy!
Intuitively, how frequently do you think prices retest the median of the current candle in the next 60 candles?
As usual, nothing in here is financial advice. I’m sharing my journey and the little knowledge I have about programming :)
[Not affiliated] - 2 Bulls in a China Shop
Before we start, I’d like to introduce you to a podcast I discovered fairly recently called 2 Bulls in a China Shop. You know I’m a BIG trading podcast fan, so when I received the opportunity to be the guest in one of them… I went outside my comfort zone and did a podcast with them last week that should be released during the first week of March!
Kyle was the host, and Scruffy was the other guest.
It was a very fun experience, and I want to thank Kyle and Scruffy, who were amazing and made things easy for me. Kyle is an aspiring trader and co-host of the 2 Bulls in a China Shop podcast. His trading focuses mainly on ES futures and longer-term options swings with a focus on chart analysis. He began his journey to becoming a full-time trader with an investment mindset and the goal of early retirement from his career in the steel industry.
Finally, thank you to Joel, a long-time reader, who connected me with 2 Bulls in a China Shop. I’m never asking for a favor, but if you could, please make sure to subscribe to their Spotify podcast. I added the description of the podcast at the end of the article.
Thank you.
The Backtest
Alright, let’s get to work!
First thing first, we need some data. I use Polygon as my service provider for crypto and stocks, and soon for options if I ever decide to get serious about them (now I’m just using finance, which is free for learning options and messing around with data).

What I like about Polygon is that if you suck with databases (just like me), they have all the data in their database, and you just have to query whatever data you want, and you’ll have them in (micro)seconds.
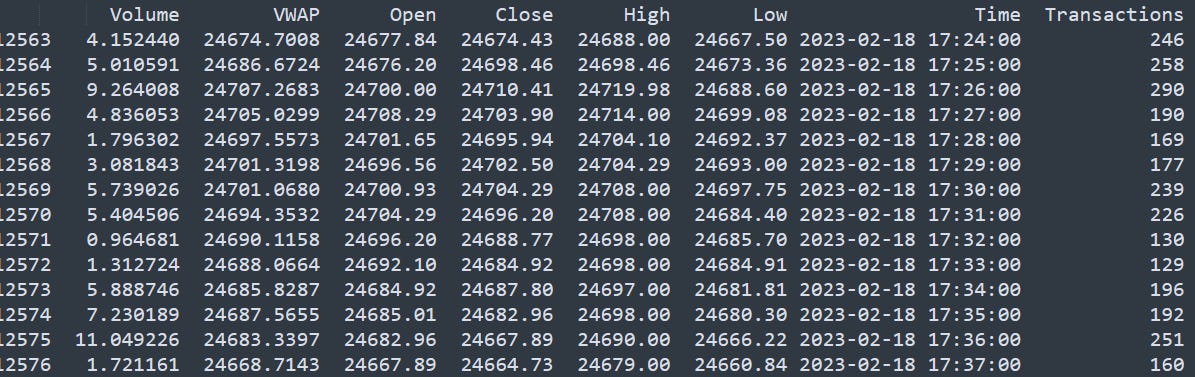
Some explanations of the data we got from this extract:
v is for volume;
vw is for VWAP;
o/c/h/l are for open, close, high, and low;
t is for timestamp (we will need some formatting here, which is always painful); and
n is the number of transactions during that timeframe (here, we have 1-minute candlestick bars).
After two lines of code, we have this better-looking dataset.
Now, we need to add a column for the median price and create our test function to see how often prices return to that median price in the next 60 candles.
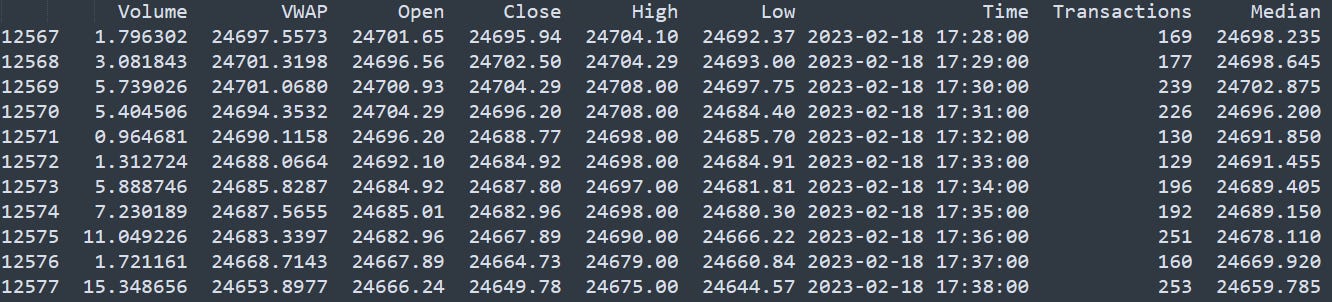
Ok, it seems we have our data in a good place now—time to work on the fun part.
The reasoning behind the backtest
We could create a loop that would check if prices return to that median price in the next 60 candles, but that wouldn’t be the most efficient solution. Instead, we can use a little trick that I learned from a much better programmer than me a few years ago. Any idea?
What we can do instead of using a loop is to extract the highest high and lowest low in the next 60 candles and compare if they cross the previous median price. It’s not going to make any drastic improvements for such a small dataset, but on a larger dataset, it should help! In other words, if the close of the current candlestick is higher than the median, we want the lowest low of the next 60 candles to be lower than the median. If the close of the current candlestick is lower than the median, we want the highest high of the next 60 candles to be higher than the median. Instead of performing 60 checks, we do only 1.
Let’s look at the first results:

What does it mean? We tested 12,703 1-minute candles, and prices have retested the median of that candle 97.6% of the time in the next 60 candles.
97.6% of the time! That’s massive!! I’m actually shocked at that number. As you know, it’s easy to make mistakes in trading, so imagine how easier it is with programming.
Give me one minute, and I’ll go triple-check my code and come back to you.
….

So it was correct! On average, during the 12,872 1-minute backtested candles, 97.6% of the time, prices retested the median price in the next 60 candles (one hour). I find it fascinating. Before jumping to crazy conclusions (which you should never do), let’s take a step back and analyze what we have.
12,872 candles: this number might seem high to you, but in reality, it’s really small. It only represents 215 hours of trading or c. 9 days of trading.
97.6% seems really high, but let’s think about it differently, as we didn’t just discover the Holy Grail (sorry!). Most of the time, the close price is really close to the median price; therefore, even if right 97.6% of the time, when we’re wrong, it’s fair to assume that prices deviate significantly from our theoretical entry, resulting in serious losses.
Before transforming this into a strategy, I want to test on a larger dataset and across different timeframes to see if the stats are stable.
Here are the results below:
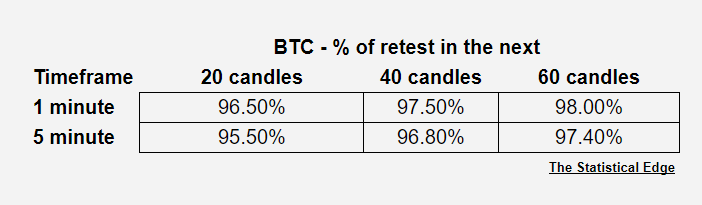
A few observations:
the likelihood of a retest increases when we increase the number of upcoming candlesticks. This is expected as we just give more opportunities to prices to retest the median price.
the likelihood is lower for a higher timeframe. It’s also important to note that it’s not the same period that has been backtested, as 50,000 1-minute candles don’t take us as far as 50,000 5-minute candles. Therefore, different market conditions can cause different results in the backtest.
Should we try to turn this into a strategy?
Of course! Get your second cup of coffee and let’s dive in.
Turning a statistic into a strategy
This is, obviously, the most difficult part. You might think we’re already ready to turn this rough idea into a cash machine, but we’re far from it. Have you ever heard of whisker plots?
If not, don’t worry; ChatGPT Pro has your back.
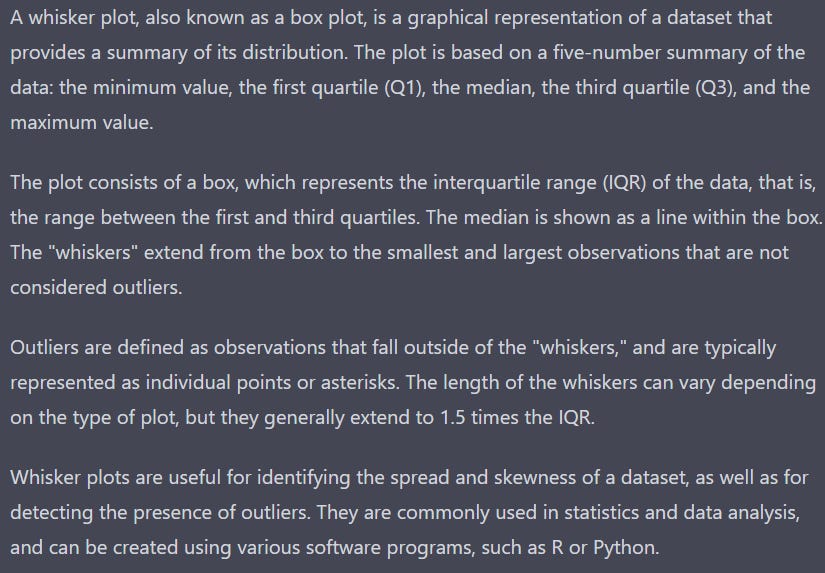
Sorry, I had to flex my new monthly subscription adding to the pile of questionable decisions I make every day.
I’m interested in understanding more about the distribution of price differences between the close of the candlestick and the median price. It might not even be enough to cover the spread if it's too close. It’s important to normalize our data and look at this from a % perspective rather than points (or dollars for BTC). This asset is volatile, so 10$ two weeks ago might be quite different than 10$ today. If you don’t understand this concept, I invite you to think about it.
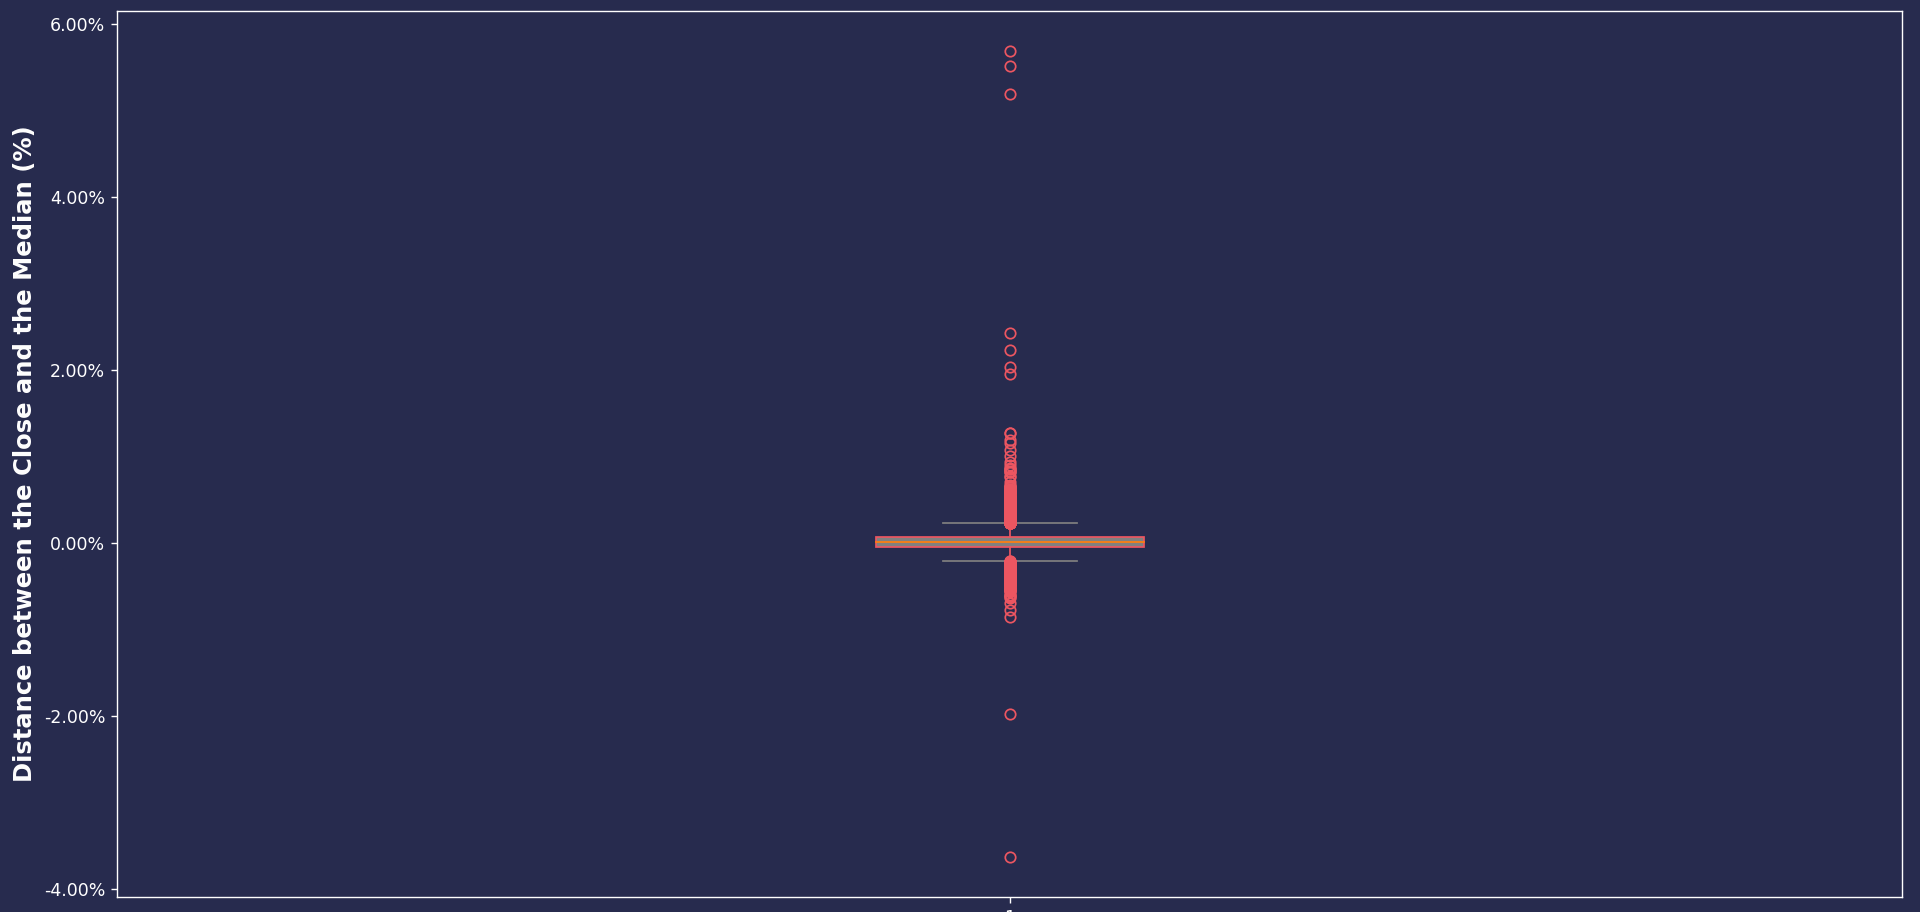
So… not surprisingly, most of the distances are close to 0%. Why? Because there is a lot of noise in the market. Same reason why the retest statistics are so high. I think this is an important takeaway from this article, and I hope you won’t take my words for granted and do some tests by yourself, as I might be wrong (as usual). Most of the time, it’s just noise. It’s our job to differentiate the noise from the real signals.
What I’m more surprised by, though, is the few outliers. There are a few data points above an absolute distance of 3%, which seems almost too high. It’s important to test our work, and bitcoin had a few crazy 1-minute candlesticks in the past two months.
Since the distance is too close for the vast majority of candlesticks, we will have to focus on those with a distance of at least 0.5%. This is to cover the spread. Why 0.5%? I could have picked something different; this is based on the visual analysis of the above chart. There seem to be enough signals to turn it into a strategy.
I’ve added in the dataframe a ‘signal’ column that equals 1 when the absolute distance is greater than 0.5%, and we will run the retest frequency on these only.

To give some perspective, 84 out of the original 50,000 candlesticks is now a much lower signal-to-universe ratio. It represents around 2 signals a day. Not too bad of a starting point.
So you get the idea now. We'll go short if we close 0.5% or more above the median. We'll go long if we close 0.5% or lower than the median. What can I say? I always want to test contrarian strategies. At this point, no one can save me.
We'll close the trade if our take profit hasn’t been hit during the 60 candles. Potentially, we can have infinite losses as prices could theoretically move against us significantly in that 1-hour interval. This is all just an example, and I want to simplify things. Of course, I don’t advise you to take this approach in your research, as a stop is always required.
Let’s look at the results.
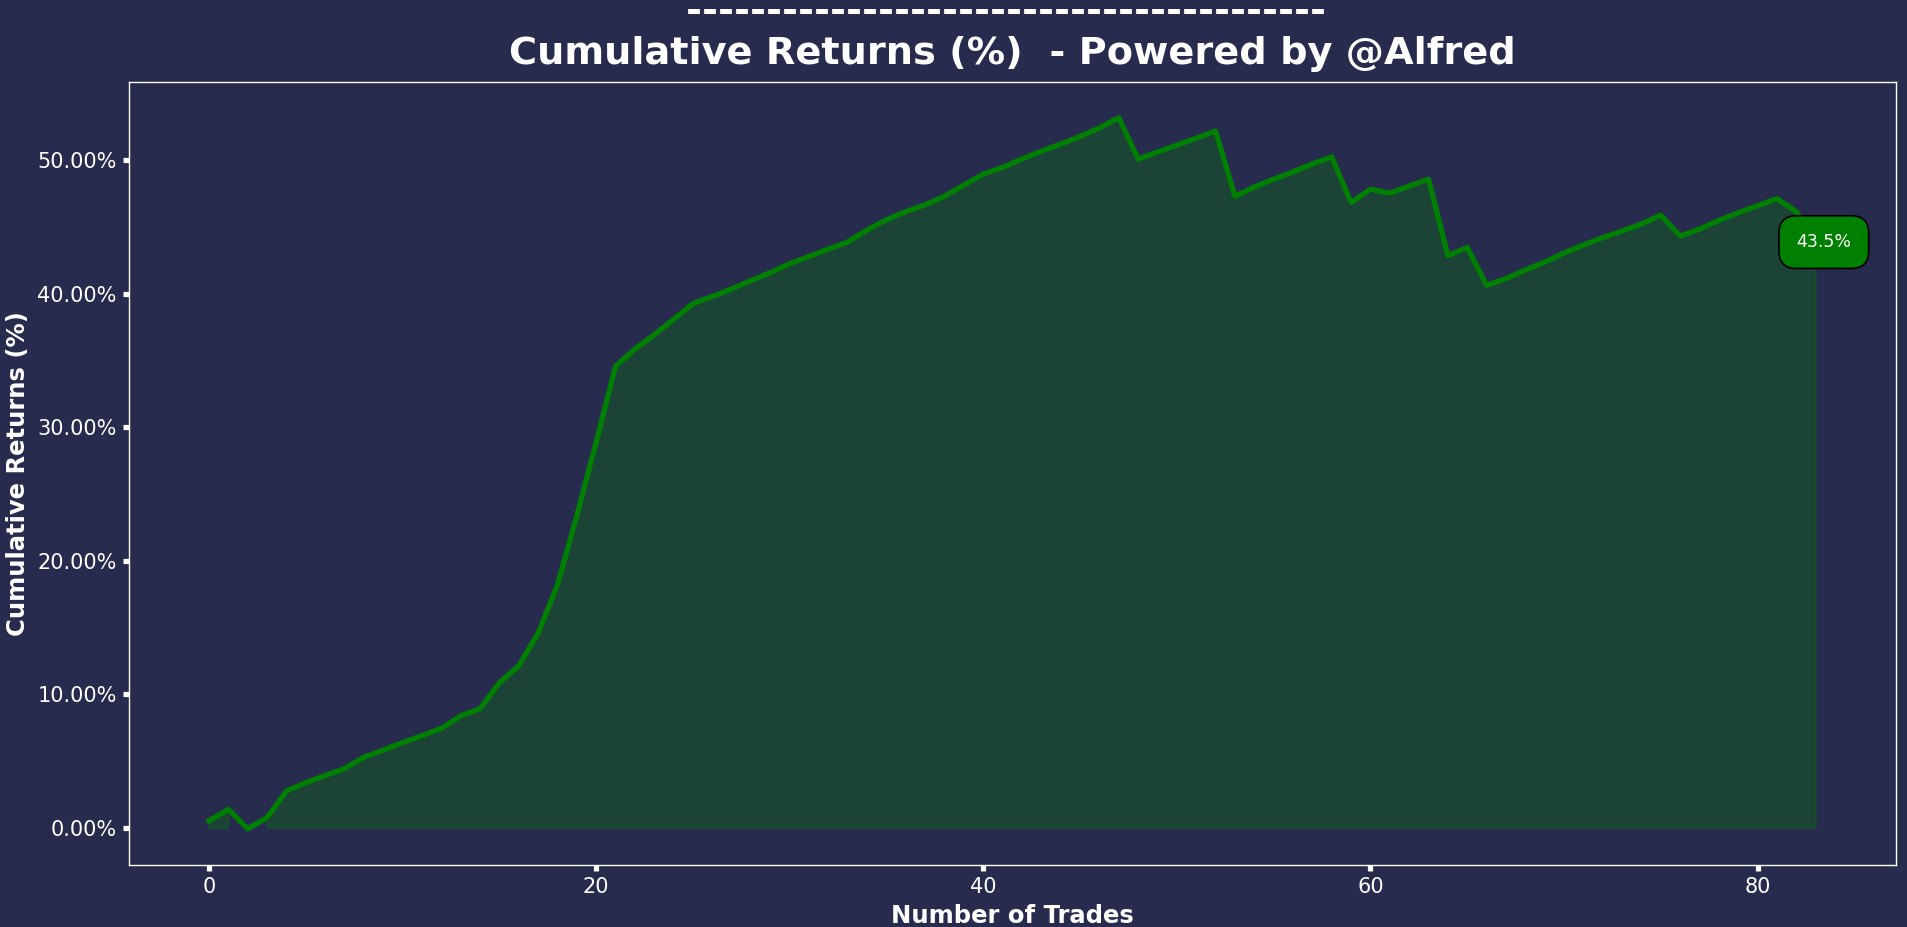
+43.5% over 84 trades with a 88% success rate.
It looks pretty good. To do something more accurate, we need to account for commission, slippage, and of course… adding a stop loss in case things go south. Just hoping prices won’t be too far off our entry after 60 candles is NOT good risk management. We would need to also test on a larger dataframe, but that wouldn’t be funny if I did all the work for you. Plus, I might have made some mistakes (hopefully not, I always do extensive checks, but always a possibility).
To be continued… by you! I hope this article gave you ideas to play with and that I was clear enough in my explanations. Otherwise, feel free to ask your questions in the comment section; I’ll do my best to answer between two trades.
The Podcast
2 Bulls in a China Shop is a collection of educational conversations, stories, news events and more! Every Saturday, hosts Kyle and Dan look at market moving news, hot stocks to watch and even a little crypto for good measure. Wednesday episodes focus on how to use that market news to inform trade ideas, and Mondays Kyle puts on his slightly more professional hat for a conversation with a friend in trading, or an expert in a field of finance. Guests include successful traders, crypto masters, financial experts, authors and CEOs. This show is guaranteed to make you learn, smile, laugh, and crave the next release! Check out the collection of mini-series for a practically personalized education from Trading Psychologist Rich Friesen, or an incredible base in the worlds of futures and options trading from members of Orderflow Labs and TRADEPRO Academy. Stick around, the shop is open, the Discord community is awesome and supportive, and everything is FREE!
Thanks for reading, folks!
It would really mean a lot if you could share this article. One of my goals for 2023 is to have 5,000 subscribers on this Substack, and I would be grateful if you could help me grow it.
Until then, stay safe.
- Retail
PS: I had a few people reaching out to me on Twitter asking why they were not receiving my emails anymore.
📬 Please ensure I’m not in your promotion/spam inbox. An easy way to ensure you’ll receive my articles is to answer this email with “Received” to add The Statistical Edge to your main inbox.
Useful links
📝Previous articles: read here
Apex affiliate link | Code = RETAILCAPITAL (50-90% off)
Twitter: @itsonlymoney12
📩 retailcapital9@gmail.com
Great post! I am curious though if ChatGPT has confessed it's love to you and tried to get you to leave your fiancée yet
Thanks for sharing.
But there’s a problem here: a high-probability win doesn’t have to be profitable. Consider tossing a coin and winning $1 each times heads comes up, whereas losing $1 otherwise. You exit the game once you either have won $1 in total or you have reached 1000 coin tosses, whatever comes first. Then your probability of winning is 97.5% but one can show mathematically that your expected profit is zero. That is because the losses incurred in the 2.5% of losing cases overwhelm all possible gains. What’s worse, due to the small loss probability, you will likely underestimate your losses whenever you backtest your strategy against a reasonably long series of coin tossing data. You would simply see your PnL increasing over time.
I guess something similar is going on here.